
All programs › BMPFast › BMPFast 2 sample problems
Mean annual rainfall: a site near Miami
South Florida: Zone 5, 59 in.
Help: Mean Annual Rainfall (help page 815) · Download the .bmpf · Link to Solution in BMPFast Version 1
1The problem
The same subdivision near Miami. The zone and rainfall change, and with them the runoff and loads.
| Input | Value | Source |
|---|---|---|
| Project (General Site Information) | ||
| Meteorological zone | Florida Zone 5 | Zone map (help page 815) |
| Mean annual rainfall | 59 in | Mean annual rainfall map (help page 815) |
| Performance standard (analysis type) | BMP Analysis | Site (illustrative) |
| Catchment 1: Subdivision (Watershed Characteristics) | ||
| Land use, pre / post | Agricultural - Pasture / Single-Family | Site (illustrative) |
| Area, pre / post | 10 / 10 ac | Site (illustrative) |
| Non-DCIA curve number, pre / post | 61 / 75 | Site (illustrative) |
| DCIA, pre / post | 0 / 25 % | Site (illustrative) |
| EMC TN, pre / post | 3.030 / 1.770 mg/L | BMPFast land use table (AH Vol I Table 9.2) |
| EMC TP, pre / post | 0.593 / 0.327 mg/L | BMPFast land use table (AH Vol I Table 9.2) |
Find: the zone and mean annual rainfall to enter, and the runoff and loads they give.
2Steps in BMPFast 2
Start BMPFast 2 and choose File ▸ New project. The tree opens on the project (General Site Information). Open its Help tab and scroll down past the help links: the first map is Florida meteorological zones (1 to 5) (the Applicant’s Handbook, Appendix M).
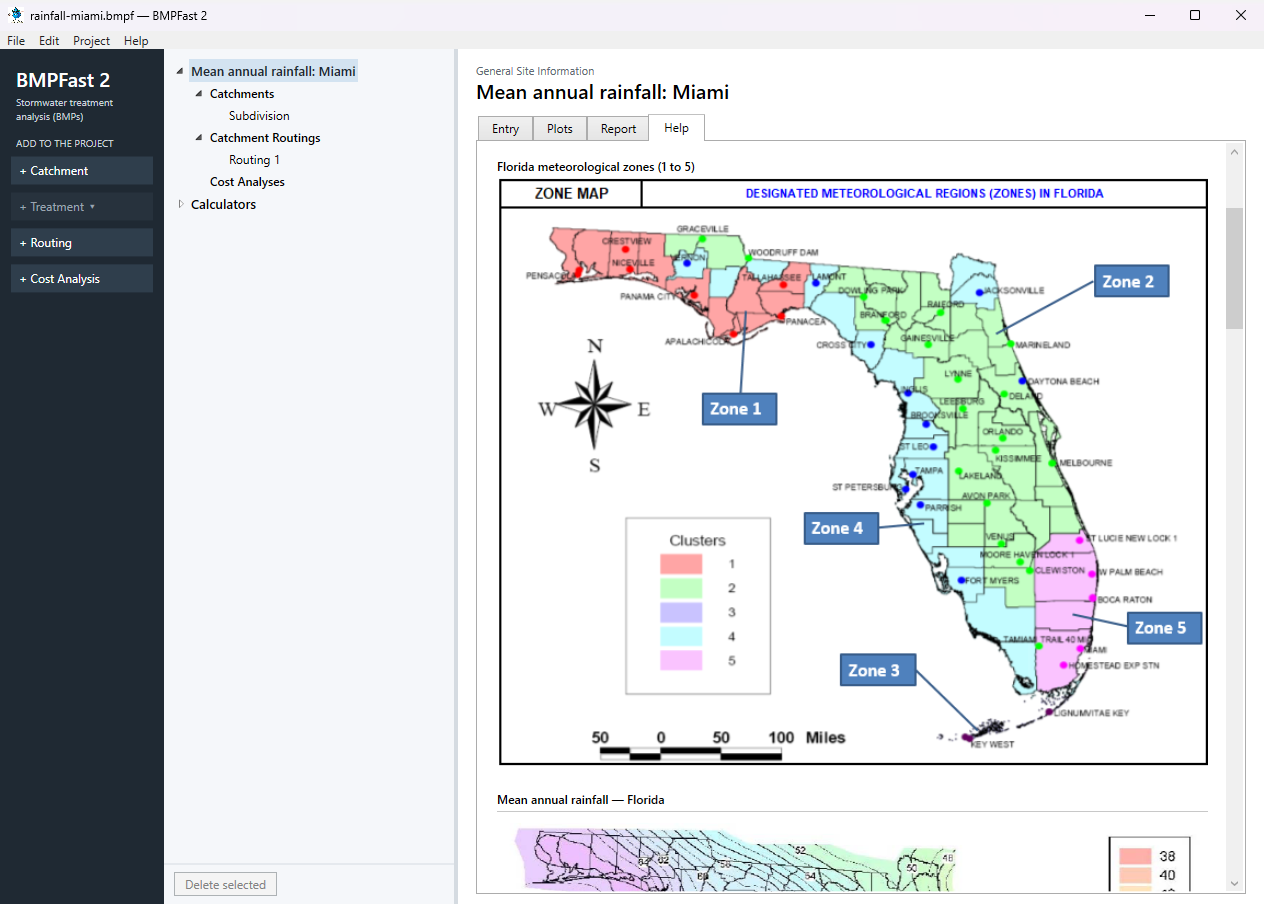
The project’s Help tab: the meteorological zone map. The zone map, as BMPFast 2 shows it. The site is in Florida Zone 5.
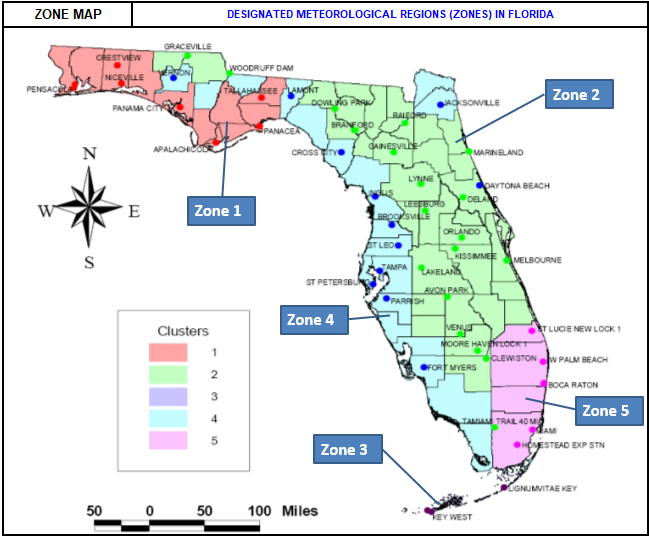
Florida meteorological zones (1 to 5), the map on the Help tab. Scroll on to Mean annual rainfall — south, the rainfall isopleths for south Florida in more detail (the whole state’s map is just above it).
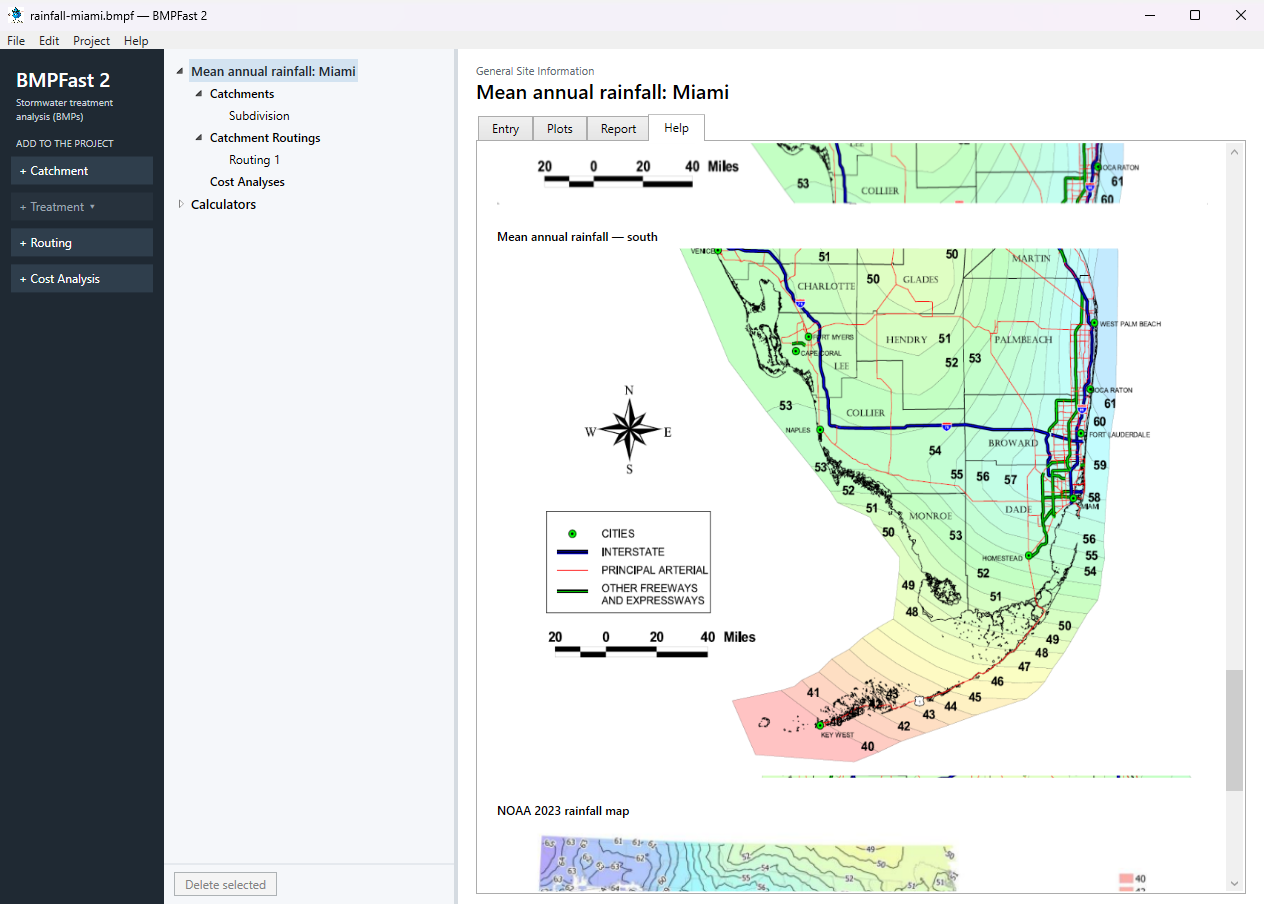
The project’s Help tab: the south rainfall map. The south map, as BMPFast 2 shows it. Read the rainfall at the site between the isopleths: about 59 in. Between two lines the engineer of record chooses the value and says so in the permit.
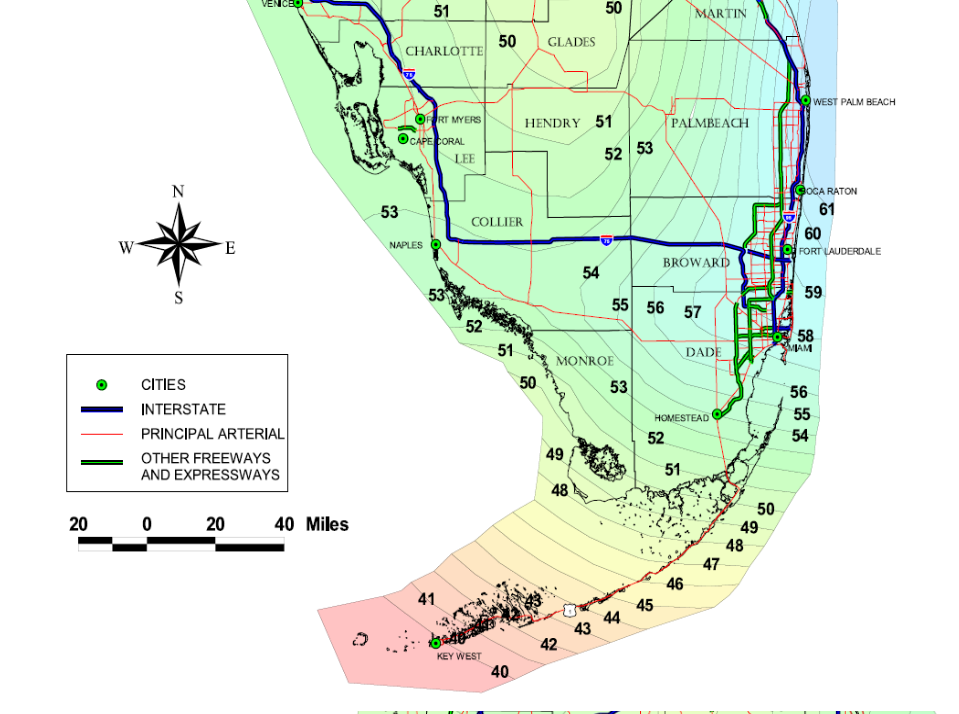
Mean annual rainfall — south, the map on the Help tab. Open the Entry tab and enter: Project name Mean annual rainfall: Miami; Meteorological zone Florida Zone 5; Mean annual rainfall 59.00 in; Type of analysis BMP Analysis. (To see the finished project instead, choose File ▸ Open and open
rainfall-miami.bmpffrom Files below.)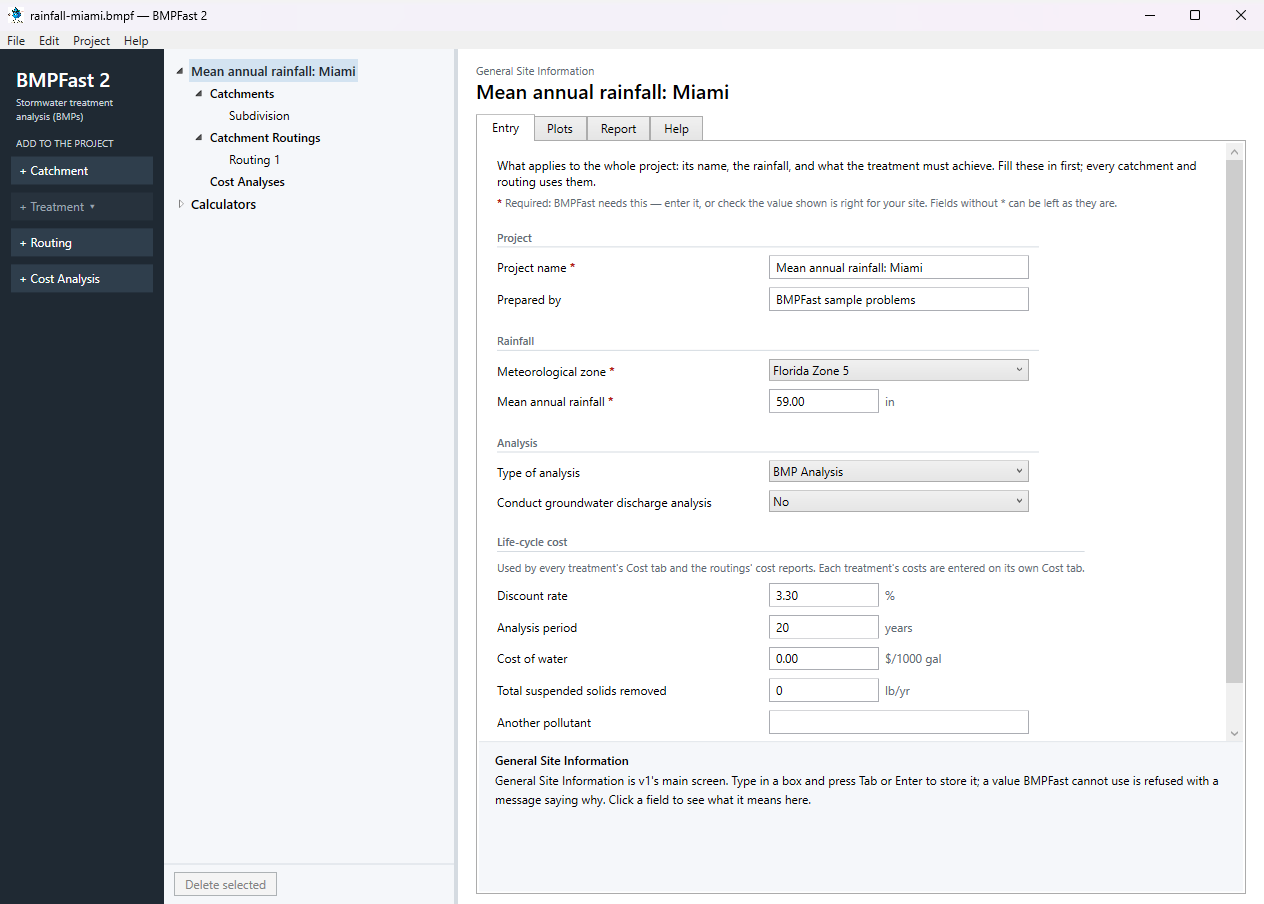
General Site Information: the project’s Entry tab. Press Add Catchment (left) and select it in the tree. On its Entry tab type the name Subdivision and enter: Land use (pre) Agricultural - Pasture; Land use (post) Single-Family; Area (pre) 10.00 ac; Area (post) 10.00 ac; Non-DCIA curve number (pre) 61.00; Non-DCIA curve number (post) 75.00; DCIA (post) 25.00 %.
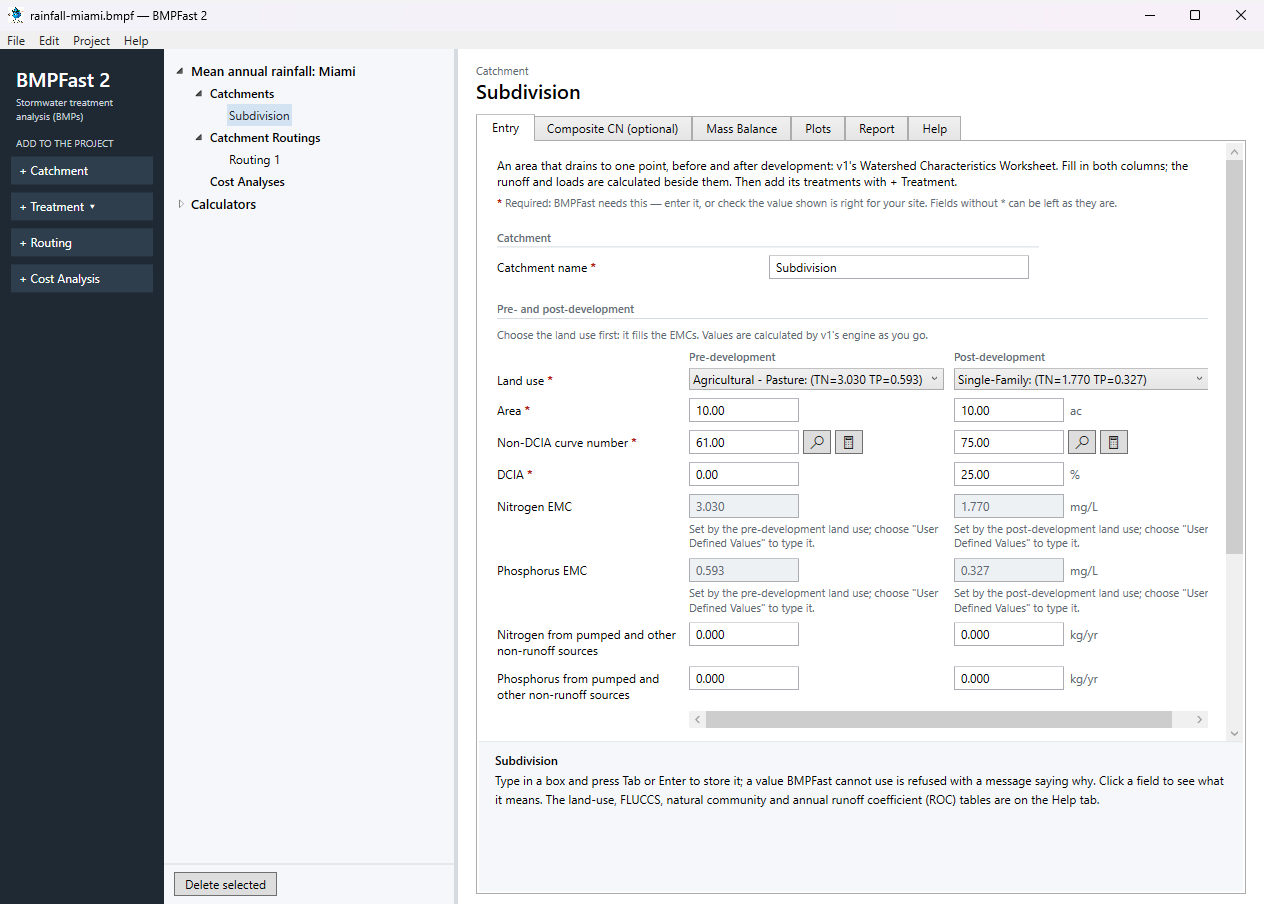
The catchment’s Entry tab. At the bottom of the Entry tab, under Calculated, BMPFast 2 works out the runoff and loads with the zone and rainfall: after development, Annual runoff coefficient (ROC) (post) 0.292; Runoff volume (post) 14.357 ac-ft/yr; Nitrogen load (post) 31.332 kg/yr; Phosphorus load (post) 5.788 kg/yr.
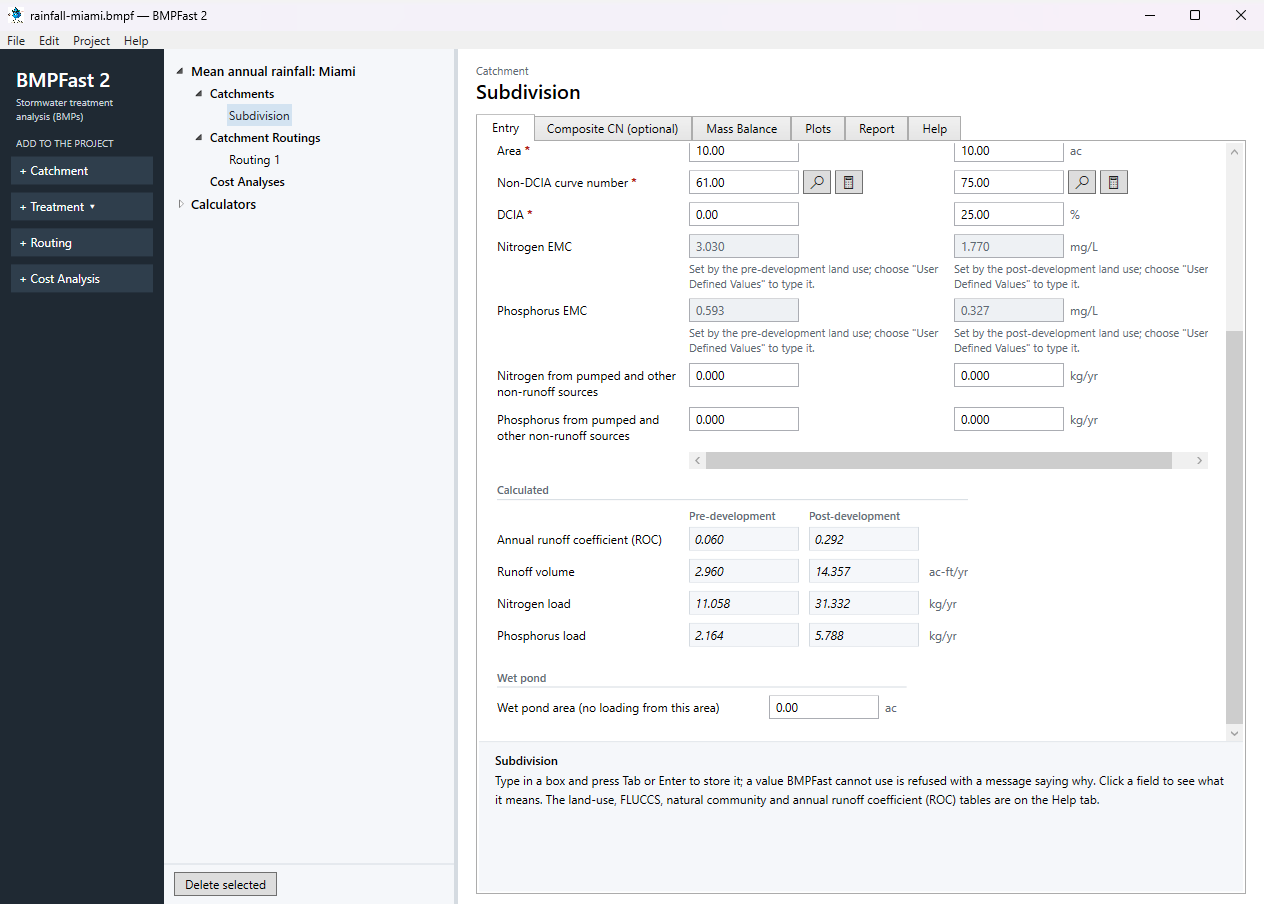
The bottom of the Entry tab: the runoff and loads for this zone and rainfall.
3Results
| Subdivision | This site (Miami) | The same catchment near Orlando |
|---|---|---|
| Meteorological zone | Florida Zone 5 | Florida Zone 2 |
| Mean annual rainfall | 59 in | 50 in |
| Annual runoff coefficient (ROC), post | 0.292 | 0.262 |
| Runoff volume, post (ac-ft/yr) | 14.357 | 10.917 |
| Nitrogen load, post (kg/yr) | 31.332 | 23.825 |
| Phosphorus load, post (kg/yr) | 5.788 | 4.402 |
| Runoff volume, pre (ac-ft/yr) | 2.960 | 1.350 |
The last column is the same project with the other site’s zone and rainfall, calculated by BMPFast 2.
BMPFast 2 and BMPFast (v1)
| Result | BMPFast 2 | BMPFast (v1), its page | |
|---|---|---|---|
| Nitrogen leaving the site | 31.332 kg/yr | 31.332 kg/yr | same |
| Phosphorus leaving the site | 5.788 kg/yr | 5.788 kg/yr | same |
| Site removal, nitrogen | 0.000 % | 0.000 % | same |
| Site removal, phosphorus | 0.000 % | 0.000 % | same |
Every number BMPFast 2 gives for this problem is the same as BMPFast (v1)’s, to three decimals.
4Check
Runoff.
| Annual runoff | = ROC × rainfall × area |
0.292 × 59 in / 12 × 10 ac = 14.357 ac-ft/yr (BMPFast 2 14.357). The load is the runoff × the EMC × 1.233 (kg per mg/L per ac-ft):
| 14.357 × 1.770 × 1.233 | = 31.332 kg/yr of nitrogen (BMPFast 2 31.332). |
Zone and rainfall. The runoff is in direct proportion to the rainfall, for the same ROC. The zone changes the ROC itself (Appendix N tables: 0.292 in Florida Zone 5, 0.262 in Florida Zone 2) and the BMP efficiency tables (Appendix O), so both must be the site’s (help page 815, help page 823).
5Files
- rainfall-miami.bmpf: the project, saved by BMPFast 2. Save it (your browser puts it in Downloads), then in BMPFast 2 choose File ▸ Open and open it. Opened again and calculated, it gives the numbers on this page.
- rainfall-miami.bmpt: the same project as BMPFast (v1) saved it. BMPFast 2 opens it too (File ▸ Open); saving it then makes a .bmpf and leaves the .bmpt as it was.
- Routing 1 (BMPFast 2’s report, as Open in browser on its Report tab gives it)
- Routing 1 — Summary Report (BMPFast 2’s report, as Open in browser on its Report tab gives it)
6Help and methodology
Calculated with BMPFast 2 version 2.0.0 (2026-10-20), which opens the problem’s v1 project as it is. Screen captures are of BMPFast 2’s own window and are for demonstration only.