
All programs › BMPFast › BMPFast 2 sample problems
Composite CN: post-development lots
Lawns, unconnected roofs and open space in a 10-acre subdivision.
Help: Composite CN Calculator (help page 811) · Download the .bmpf · Link to Solution in BMPFast Version 1
1The problem
A 10-acre subdivision has 25 % DCIA. Its other 7.5 ac are lawns (5.0 ac, CN 61), roofs and driveways that do not connect (1.5 ac, CN 98) and open space (1.0 ac, CN 69).
| Input | Value | Source |
|---|---|---|
| Project (General Site Information) | ||
| Meteorological zone | Florida Zone 2 | Zone map (help page 815) |
| Mean annual rainfall | 50 in | Mean annual rainfall map (help page 815) |
| Performance standard (analysis type) | BMP Analysis | Site (illustrative) |
| Catchment 1: Subdivision (Watershed Characteristics) | ||
| Land use, pre / post | Agricultural - Pasture / Single-Family | Site (illustrative) |
| Area, pre / post | 10 / 10 ac | Site (illustrative) |
| Non-DCIA curve number, pre / post | 61 / 83.81 | Site (illustrative) |
| DCIA, pre / post | 0 / 25 % | Site (illustrative) |
| EMC TN, pre / post | 3.030 / 1.770 mg/L | BMPFast land use table (AH Vol I Table 9.2) |
| EMC TP, pre / post | 0.593 / 0.327 mg/L | BMPFast land use table (AH Vol I Table 9.2) |
| Parts of the non-DCIA area | ||
| 5 ac | CN 61 | Site (illustrative) |
| 1.5 ac | CN 98 | Site (illustrative) |
| 1 ac | CN 69 | Site (illustrative) |
Find: the composite non-DCIA curve number and its effect on the runoff.
2Steps in BMPFast 2
Start BMPFast 2 and choose File ▸ New project. The tree on the left opens on the project (General Site Information). On its Entry tab enter: Project name Composite CN: post-development lots; Meteorological zone Florida Zone 2; Mean annual rainfall 50.00 in; Type of analysis BMP Analysis. (To see the finished project instead, choose File ▸ Open and open
composite-cn-post.bmpffrom Files below.)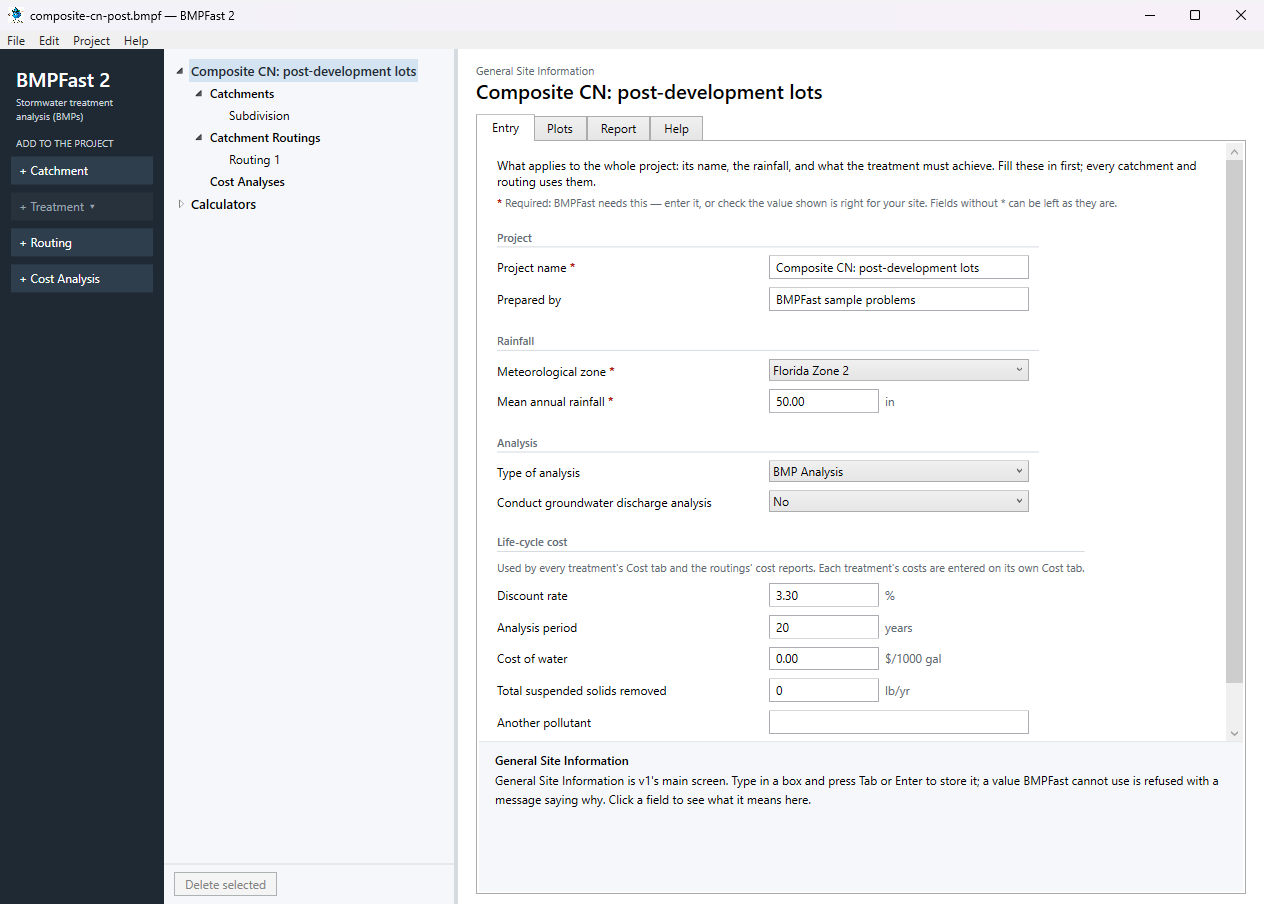
General Site Information: the project’s Entry tab. Press Add Catchment (left) and select the new catchment in the tree. On its Entry tab type the name Subdivision and enter: Land use (pre) Agricultural - Pasture; Land use (post) Single-Family; Area (pre) 10.00 ac; Area (post) 10.00 ac; Non-DCIA curve number (pre) 61.00; Non-DCIA curve number (post) 75.00; DCIA (post) 25.00 %. BMPFast 2 works out the post-development runoff as you type: ROC 0.262, 10.917 ac-ft/yr. The curve number 75 is a guess for the whole non-DCIA area; its parts have different covers.
Open the catchment’s Composite CN (optional) tab (or press the calculator button beside the post-development non-DCIA curve number). In the post-development table type each part’s area and non-DCIA curve number: 5 ac at CN 61, 1.5 ac at CN 98, 1 ac at CN 69 (the search button beside a curve number picks it from the SCS table). A new line opens as each one is filled. The line Composite shows the composite curve number, 83.81. The note under the table checks that the parts add up to the post-development area less the DCIA: 7.5 ac. Press Use this CN.
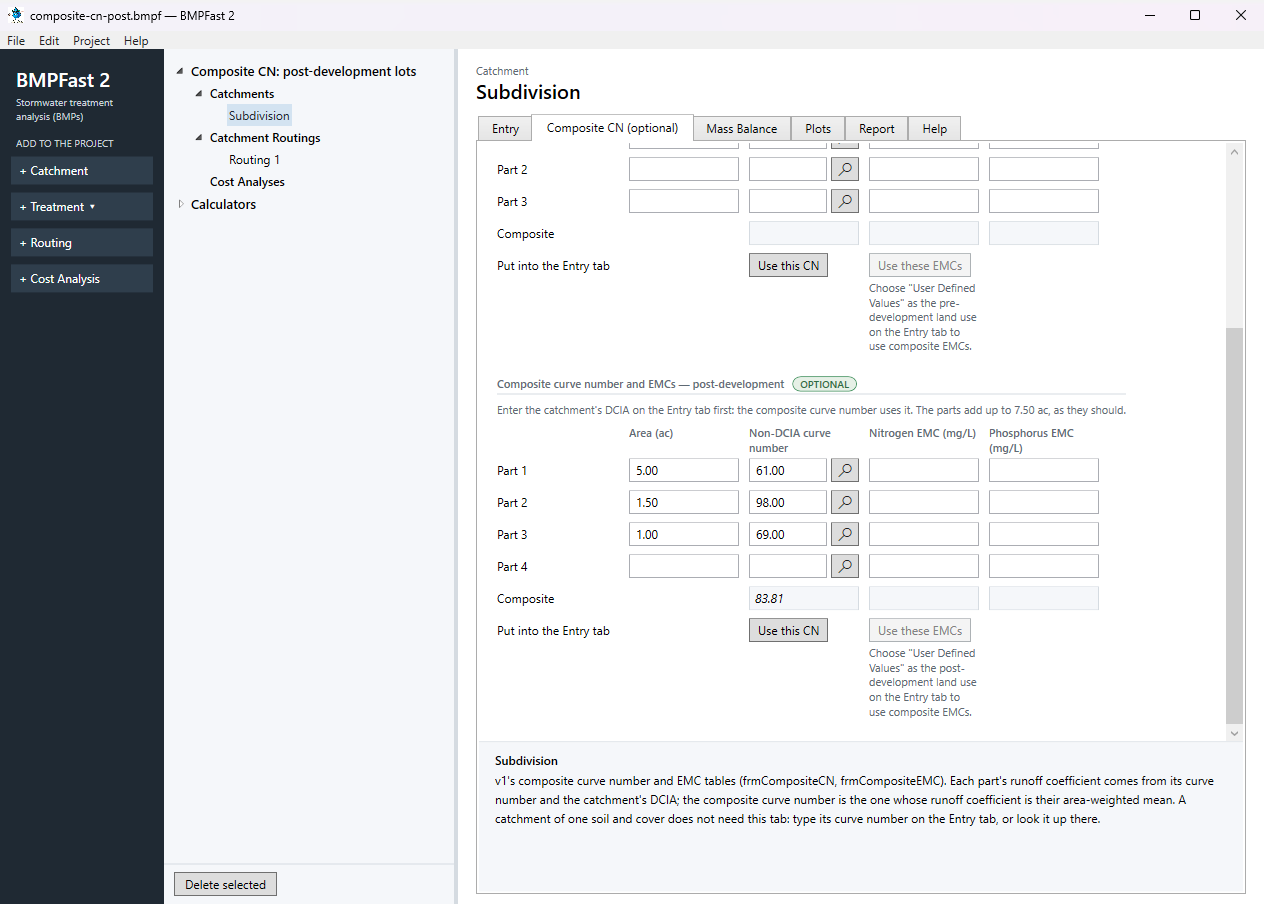
The catchment’s Composite CN (optional) tab: the post-development parts and their composite. BMPFast 2 goes back to the Entry tab with the post-development non-DCIA curve number now 83.81; the line at the top says it is the composite of the parts on the Composite CN tab. (Change a part later and that line says the box no longer matches.)
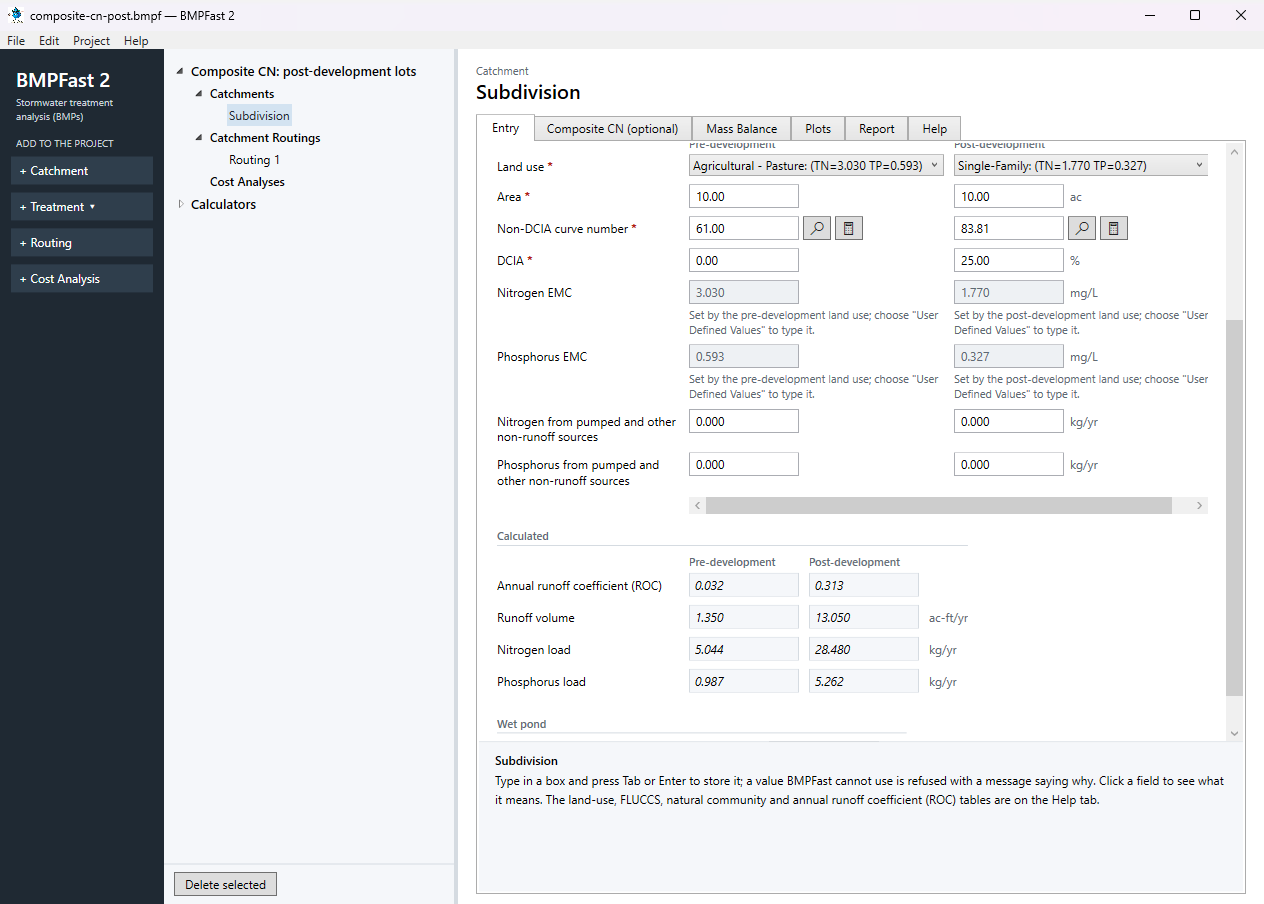
The catchment’s Entry tab after Use this CN. At the bottom of the Entry tab, under Calculated, the runoff and loads are worked out again with the composite. Save the project with File ▸ Save; compare it with
composite-cn-post.bmpfunder Files.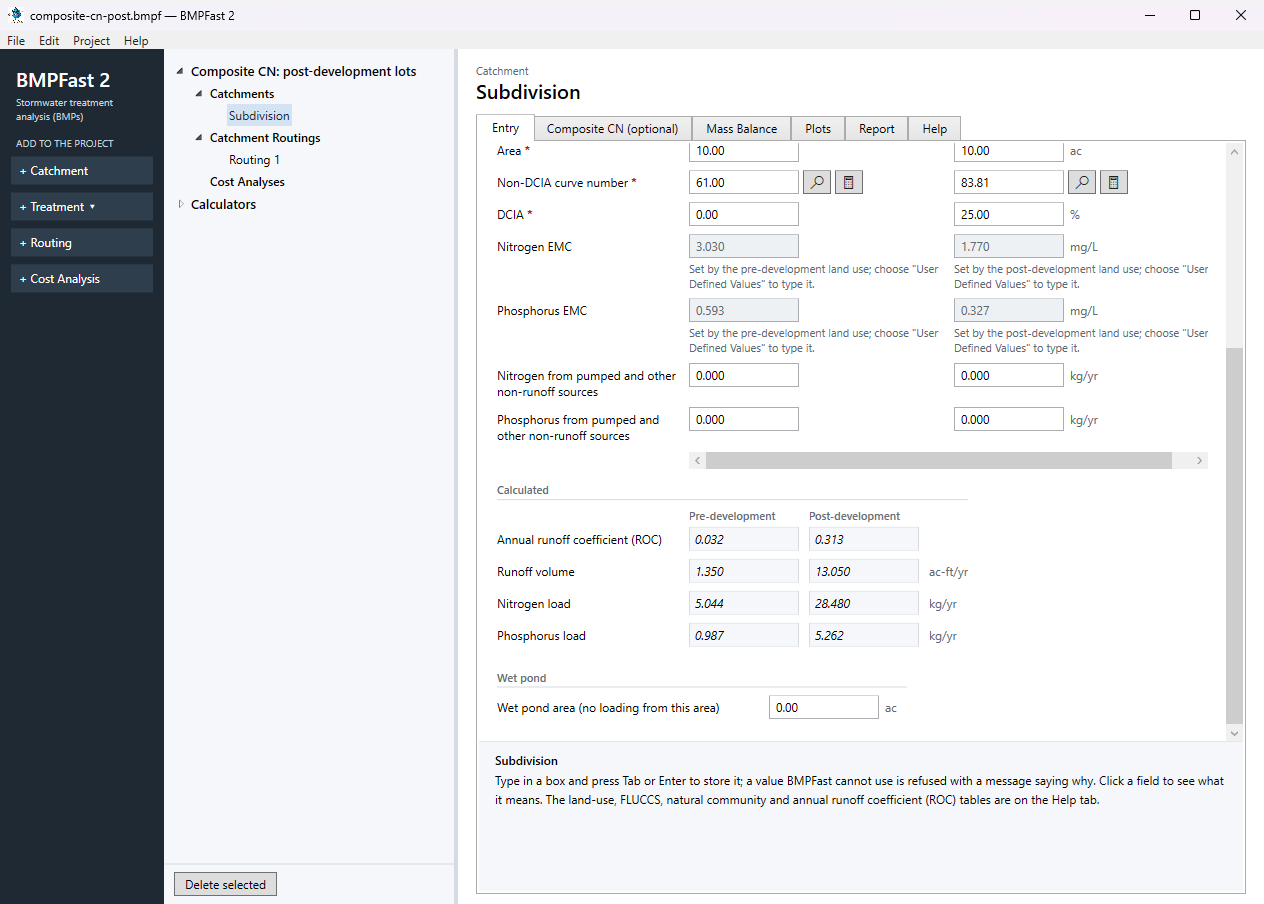
The bottom of the Entry tab: the runoff and loads with the composite curve number.
3Results
| Result | Value |
|---|---|
| Composite curve number | 83.81 |
| Area-weighted runoff coefficient | 0.3132 |
| Curve number put into the Entry tab | 83.81 |
The catchment before and after (post-development)
| CN 75 (typed) | Composite CN | |
|---|---|---|
| Non-DCIA curve number | 75 | 83.81 |
| Annual runoff coefficient (ROC) | 0.262 | 0.313 |
| Runoff volume (ac-ft/yr) | 10.917 | 13.050 |
| Nitrogen load (kg/yr) | 23.825 | 28.480 |
| Phosphorus load (kg/yr) | 4.402 | 5.262 |
BMPFast 2 and BMPFast (v1)
| Result | BMPFast 2 | BMPFast (v1), its page | |
|---|---|---|---|
| Nitrogen leaving the site | 28.480 kg/yr | 28.480 kg/yr | same |
| Phosphorus leaving the site | 5.262 kg/yr | 5.262 kg/yr | same |
| Site removal, nitrogen | 0.000 % | 0.000 % | same |
| Site removal, phosphorus | 0.000 % | 0.000 % | same |
Every number BMPFast 2 gives for this problem is the same as BMPFast (v1)’s, to three decimals.
4Check
| Part | Area (ac) | Non-DCIA CN | Runoff coefficient C | Area-weighted C |
|---|---|---|---|---|
| Part 1 | 5 | 61 | 0.2268 | 0.1512 |
| Part 2 | 1.5 | 98 | 0.6480 | 0.1296 |
| Part 3 | 1 | 69 | 0.2428 | 0.0324 |
Method.
BMPFast does not average the curve numbers. It finds each part’s annual runoff coefficient C (Appendix N, at that CN and the catchment’s DCIA of 25 %), weights C by area, and then finds the CN that gives the weighted C.
| Weighted C | = (5 × 0.2268 + 1.5 × 0.6480 + 1 × 0.2428) / 7.5 |
| = 0.3132 (BMPFast 2 0.3132) |
the CN with that C is 83.81. A plain area-weighted CN would be 69.47, which does not give the same annual runoff (help page 811).
The same table is also under Calculators ▸ Composite Curve Number, for working out a curve number without putting it into a catchment.
5Files
- composite-cn-post.bmpf: the project, saved by BMPFast 2. Save it (your browser puts it in Downloads), then in BMPFast 2 choose File ▸ Open and open it. Opened again and calculated, it gives the numbers on this page.
- composite-cn-post.bmpt: the same project as BMPFast (v1) saved it. BMPFast 2 opens it too (File ▸ Open); saving it then makes a .bmpf and leaves the .bmpt as it was.
- Routing 1 (BMPFast 2’s report, as Open in browser on its Report tab gives it)
- Routing 1 — Summary Report (BMPFast 2’s report, as Open in browser on its Report tab gives it)
6Help and methodology
Calculated with BMPFast 2 version 2.0.0 (2026-10-20), which opens the problem’s v1 project as it is. Screen captures are of BMPFast 2’s own window and are for demonstration only.