TrafficLab+
Turn a real intersection into a web page with a live traffic simulation — a puzzle students solve on a budget, then hand in as a link.
FreeOn the Microsoft StoreVersion 1.0For Windows PCs
What it is
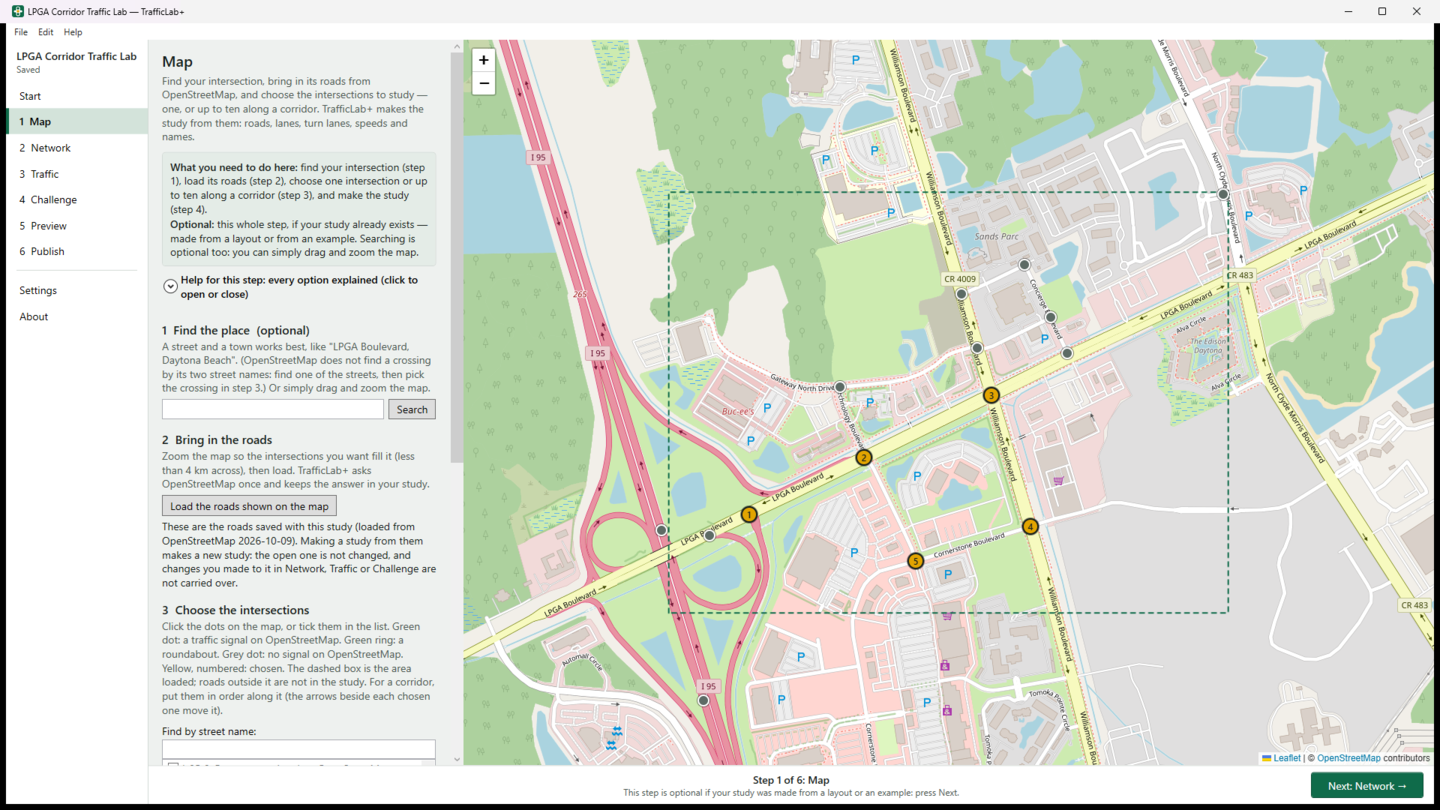
TrafficLab+ turns a real intersection, or a corridor of up to ten, into one web page with a live traffic simulation. You find the place on a map, the program brings in its roads from OpenStreetMap, you set the traffic and the challenge, and TrafficLab+ builds the page.
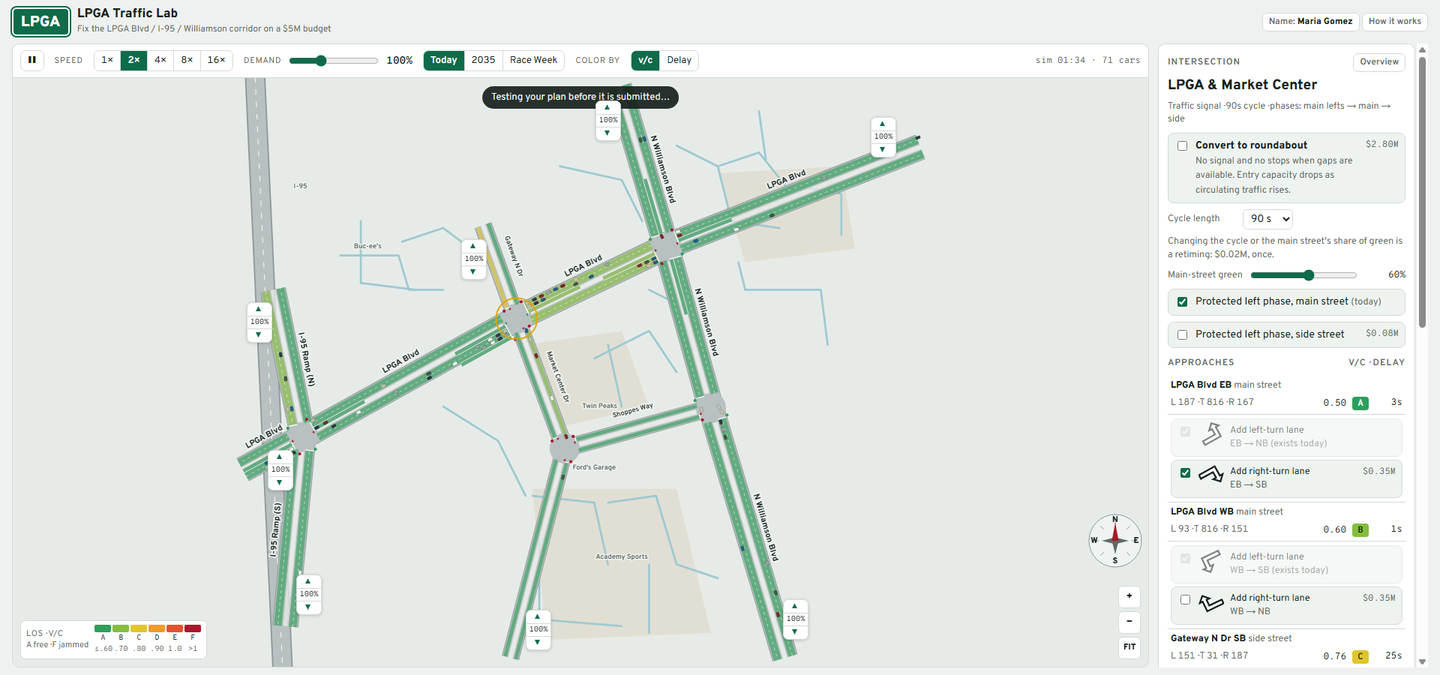
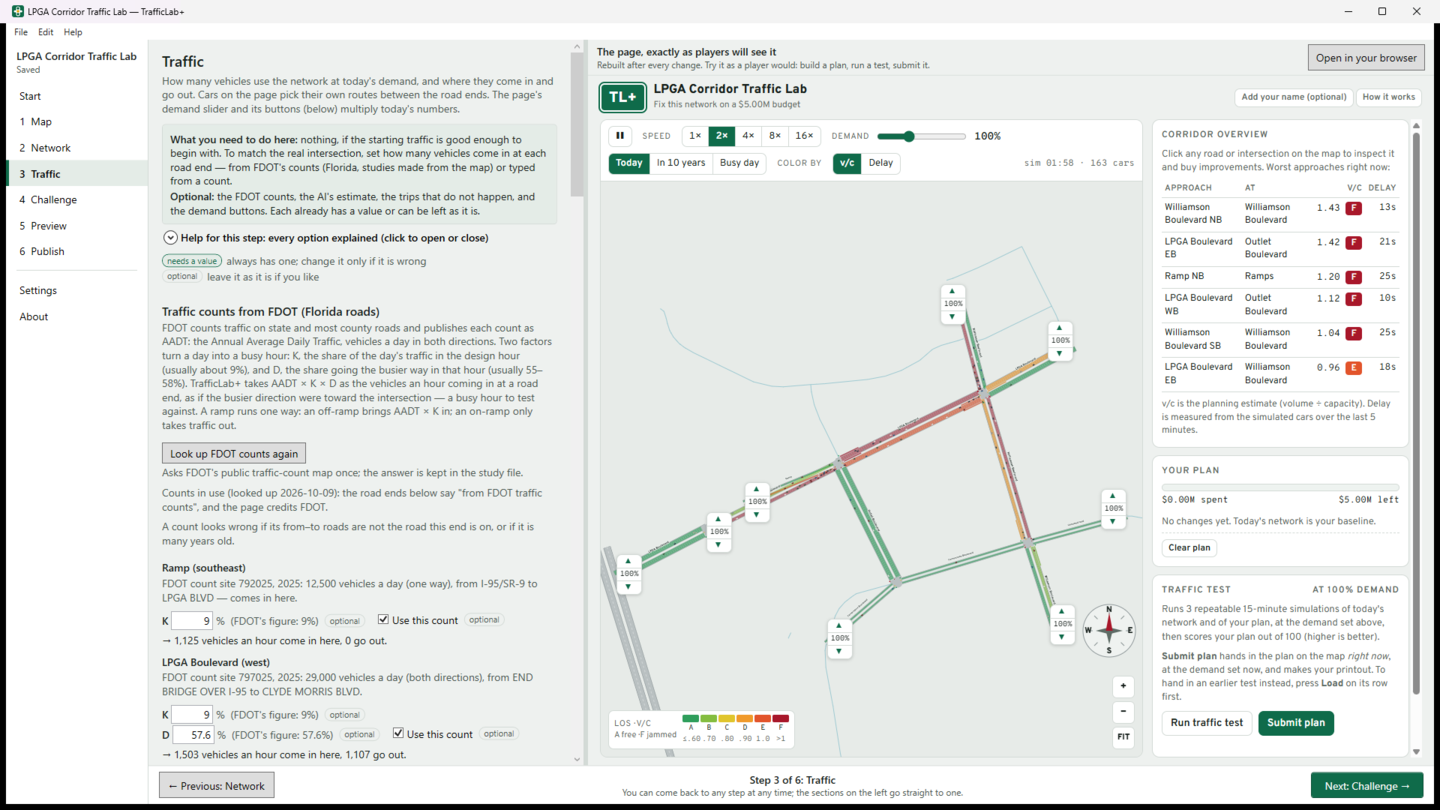
On the page, cars follow a real car-following model, the signals cycle through their phases, and every road is shaded by its Level of Service, from A (traffic flows freely) to F (jammed). A player sees today's traffic and builds a plan to fix it within a budget: turn lanes, extra lanes, signal timing, roundabouts. They test the plan against today's network, get a score out of 100, and submit it for a printout. Students hand in the page as a link.
It grew out of Dr. Ron Eaglin's LPGA Traffic Lab, a classroom simulation of the LPGA Boulevard corridor at I-95 in Daytona Beach, which is built in as an example.

After it installs, open it from the Start menu. Want to see what it makes first? Play the two example pages below.
Help
How to use TrafficLab+: start from a built-in example, make a study from the map, shape the network, set the traffic (typed, FDOT counts or the AI) and the challenge, see the page players get, and publish to GitHub Pages to hand in the link.
Try it: two pages TrafficLab+ made
Each is one web page that runs in your browser, on a computer, a tablet or a phone. Press Start, click a road or an intersection to see its traffic and the fixes you can buy, build a plan, press Run traffic test, then Submit plan. Your name is optional and nothing is sent anywhere.
- LPGA Traffic Lab — the LPGA Boulevard corridor at I-95 in Daytona Beach: five signals and the freeway ramps, on a $5M budget.
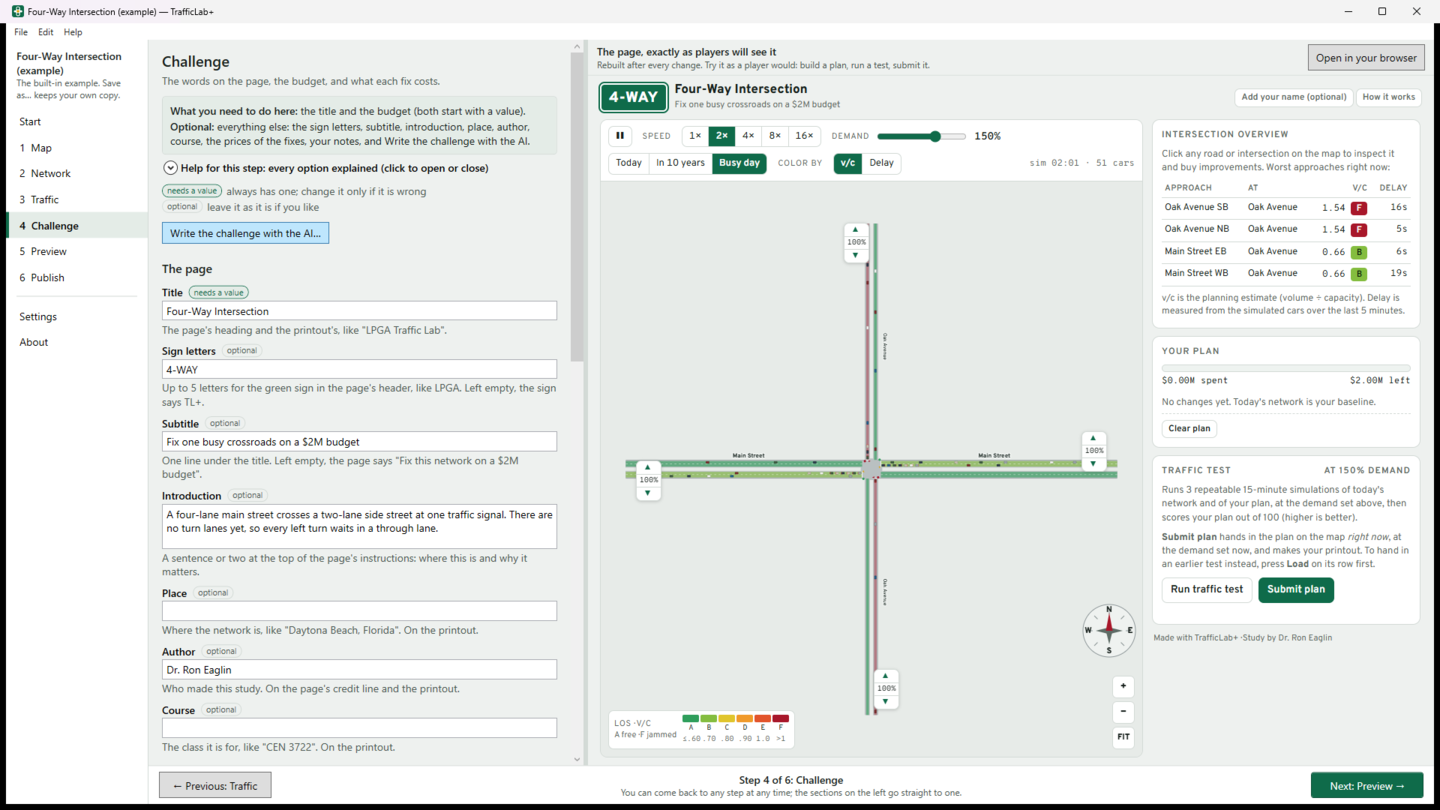
- Four-Way Intersection — one signal where a four-lane main street crosses a two-lane side street, on a $2M budget. The simplest place to start.
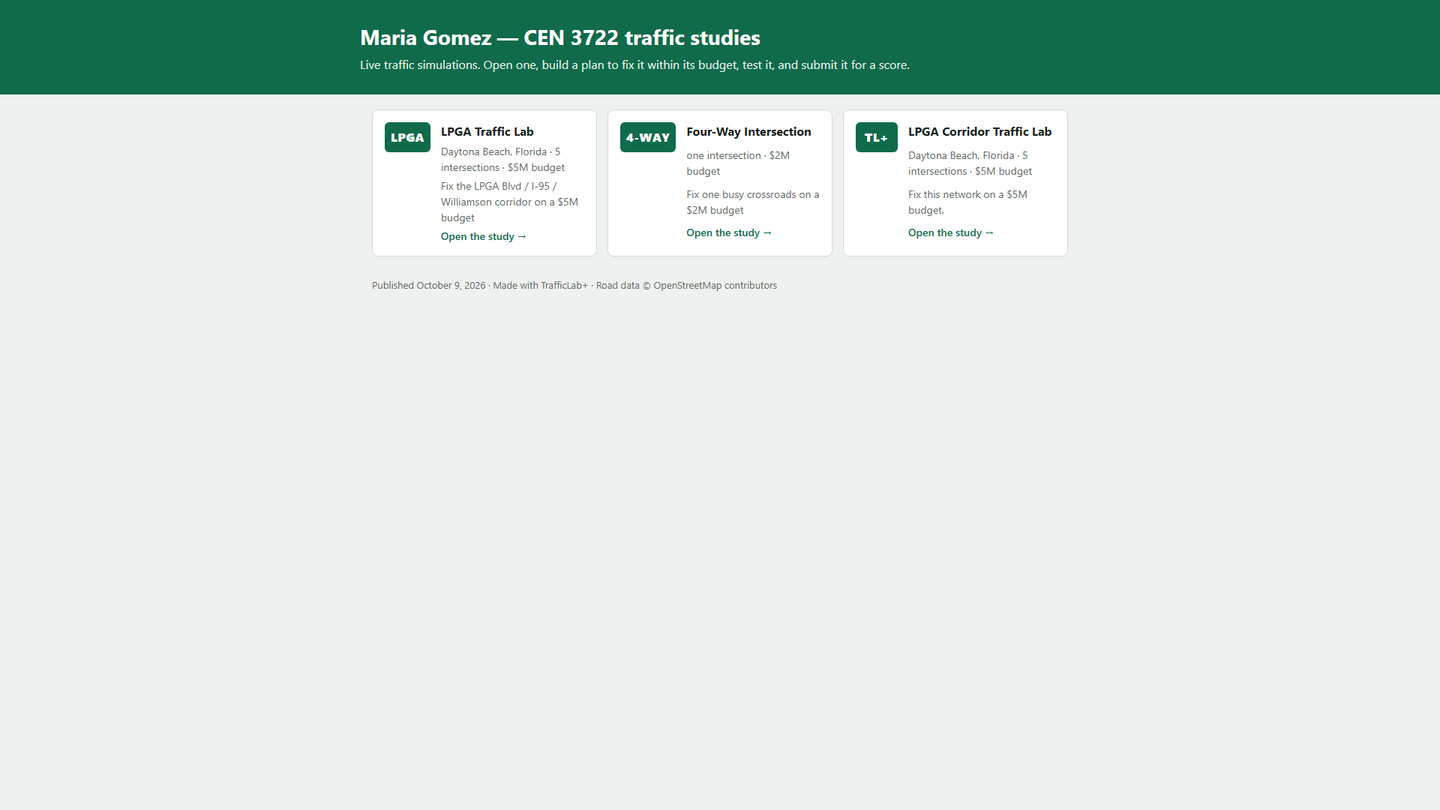
When you publish from TrafficLab+, your studies get a summary page like this one, linking to each.
What you can do
- Find your intersection on a map and bring in its real roads, lanes, turn lanes, speed limits and names from OpenStreetMap — or start from a simple layout.
- Choose one intersection, or up to ten along a corridor. Every number says where it came from: OpenStreetMap, a default, typed, FDOT or the AI.
- Fill in Florida traffic from FDOT's published counts (AADT × K × D, with the factors yours to change), or type your own from any count.
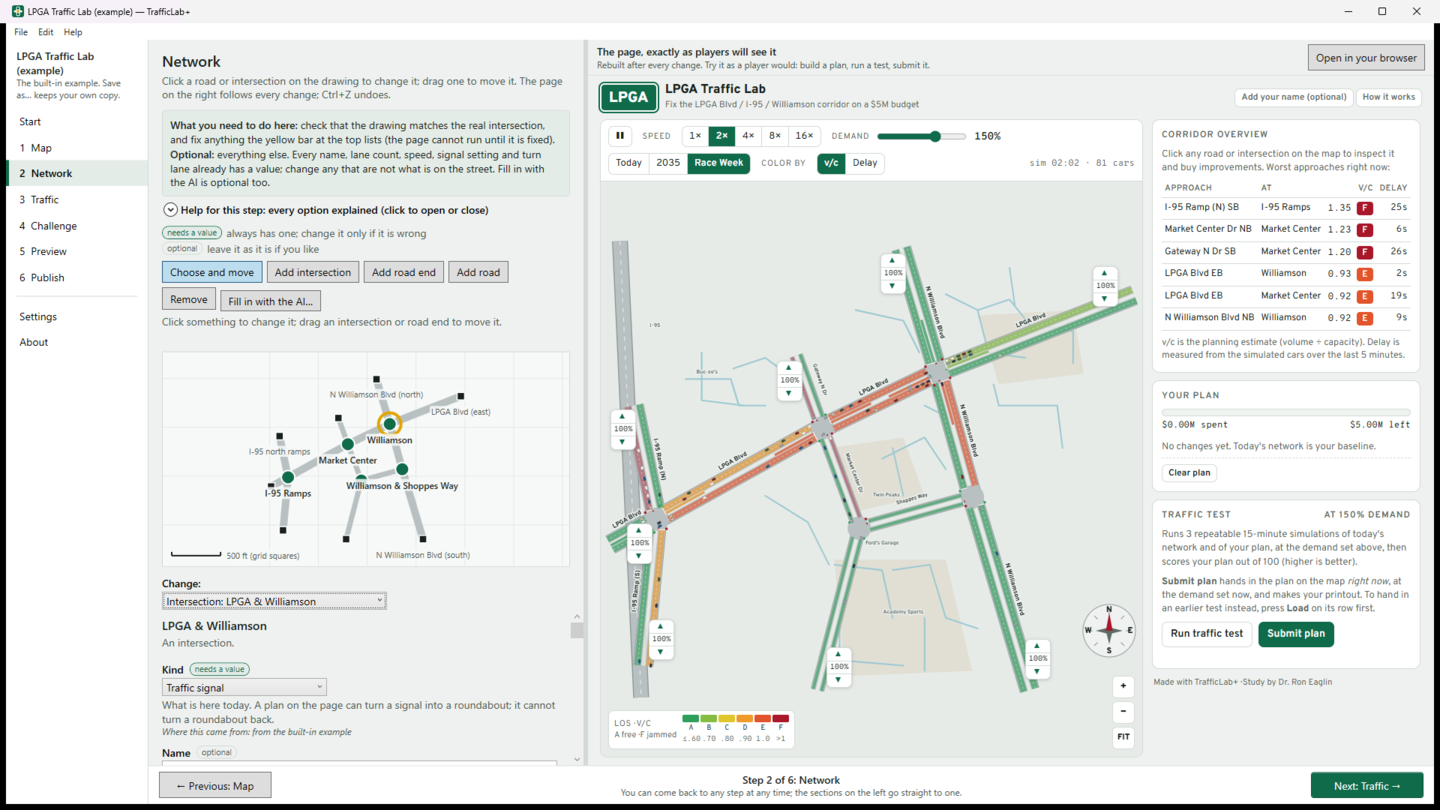
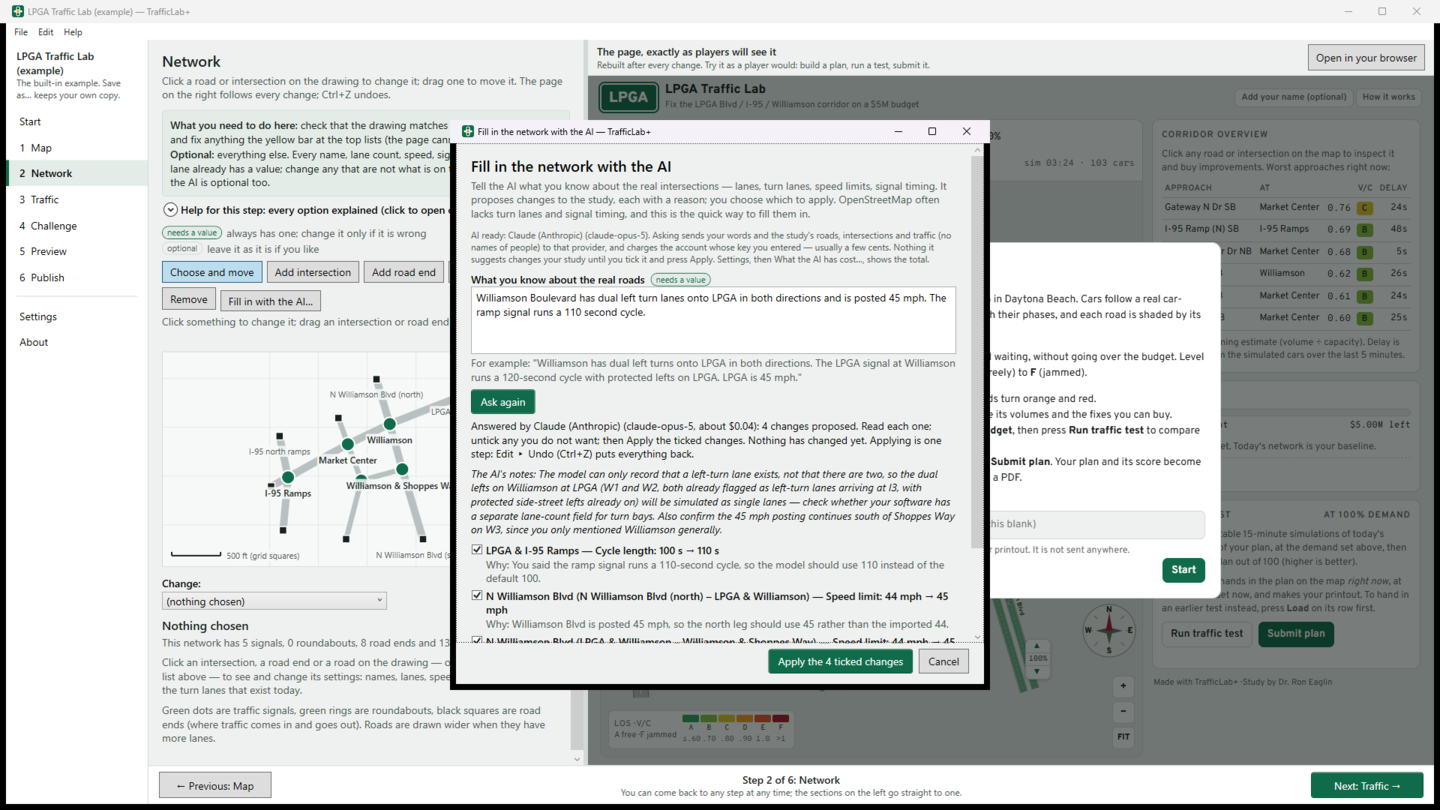
- Shape the network on a drawing, with every setting explained, and see the page rebuilt beside it after every change. Ctrl+Z undoes anything.
- Set the challenge: the budget, the price of each fix, and the demand buttons players test against — today, in ten years, a busy day.
- Publish every study you choose to one free website on GitHub Pages, with a summary page, and copy a link to hand in. Step-by-step instructions take a student through GitHub for the first time.
- Optional AI (Claude, OpenAI, Gemini, Mistral or xAI) with your own key: it fills in what the map lacks, estimates traffic, writes the challenge, and explains a traffic test. It only proposes — nothing goes into a study until you tick it.
- Every page is one file that needs nothing from the internet. No account, no ads, no tracking; the pages collect nothing from players.
What it looks like
Who it is for
Transportation and civil-engineering instructors and their students: one study for a whole class, or one per student, handed in as a link. And anyone who wants to see why an intersection backs up, and what would fix it.
What it needs
Windows 10 (version 2004 or later) or Windows 11. The map, the roads and FDOT's counts need an internet connection; the two examples do not. Publishing needs a free GitHub account. The AI is optional and needs your own key from an AI company.
Versions
1.0 (October 2026) — the first release: the map and OpenStreetMap roads, FDOT counts, the network editor with the live page beside it, the challenge, publishing to GitHub Pages, the optional AI, and the LPGA and Four-Way examples.
Privacy
Your studies stay on your computer and nothing is sent to us. TrafficLab+ goes online only for what you ask: the map and its roads (OpenStreetMap), FDOT's counts, your AI company if you use the AI, and GitHub when you publish. The pages it makes collect nothing. Read the TrafficLab+ privacy policy.