
All programs › BMPFast › BMPFast 2 sample problems
Cost analysis: a retention basin
Example Problem 3’s basin: the worked example of the Cost Analysis Methodology.
Help: Cost Analysis (help page 350) · Download the .bmpf · Link to Solution in BMPFast Version 1
1The problem
The BMPFast sample project Example Problem 3: the retention basin ($100,000 – $150,000, 20-year life, O&M 1.0 – 6.0 %), its fixed outlet structure ($10,000 – $15,000, 60 years) and mowing twice a year. Discount rate 3.3 %, 30 years, inflation 2.5 %.
| Input | Value | Source |
|---|---|---|
| Project (General Site Information) | ||
| Meteorological zone | Florida Zone 4 | Zone map (help page 815) |
| Mean annual rainfall | 50 in | Mean annual rainfall map (help page 815) |
| Performance standard (analysis type) | Specified Removal Efficiency | BMPFast sample project |
| Specified removal: TN / TP | 75 % / 75 % | BMPFast sample project |
| Cost analysis | ||
| Discount rate | 3.3 % | Cost analysis parameters |
| Duration | 30 years | Cost analysis parameters |
| BMP inflation rate | 2.5 % | Cost analysis parameters |
Find: the present worth, the annual cost and the cost per pound of TN and TP removed.
2Steps in BMPFast 2
Start BMPFast 2 and choose File ▸ New project. The tree on the left opens on the project (General Site Information). On its Entry tab enter: Project name Example Problem # 3; Meteorological zone Florida Zone 4; Mean annual rainfall 50.00 in; Type of analysis Specified Removal Efficiency; Nitrogen Removal Performance Specified 75 %; Phosphorus Removal Performance Specified 75 %. (To follow along with the finished project instead, choose File ▸ Open and open
cost-retention-basin.bmpffrom Files below.)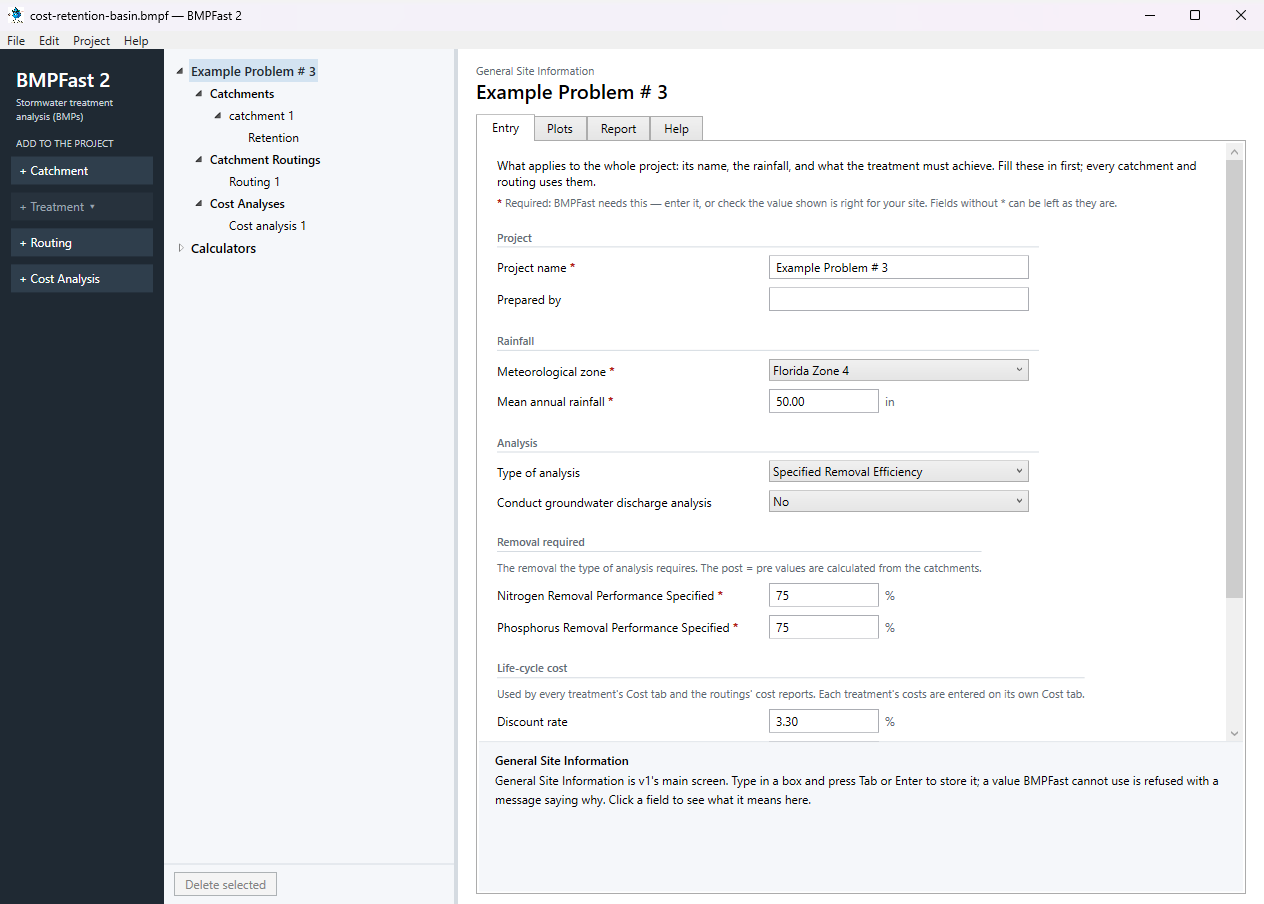
General Site Information: the project’s Entry tab. Press Add Catchment (left). Select the new catchment in the tree; on its Entry tab type the name catchment 1 and enter: Land use (pre) Agricultural - Pasture; Land use (post) Single-Family; Area (pre) 11.00 ac; Area (post) 11.00 ac; Non-DCIA curve number (pre) 50.00; Non-DCIA curve number (post) 65.00; DCIA (post) 25.00 %. Leave the other boxes as they are (0 or blank). BMPFast 2 calculates as you type; scroll down to Calculated for the results after development: Annual runoff coefficient (ROC) (post) 0.246; Runoff volume (post) 11.275 ac-ft/yr; Nitrogen load (post) 24.607 kg/yr; Phosphorus load (post) 4.546 kg/yr.
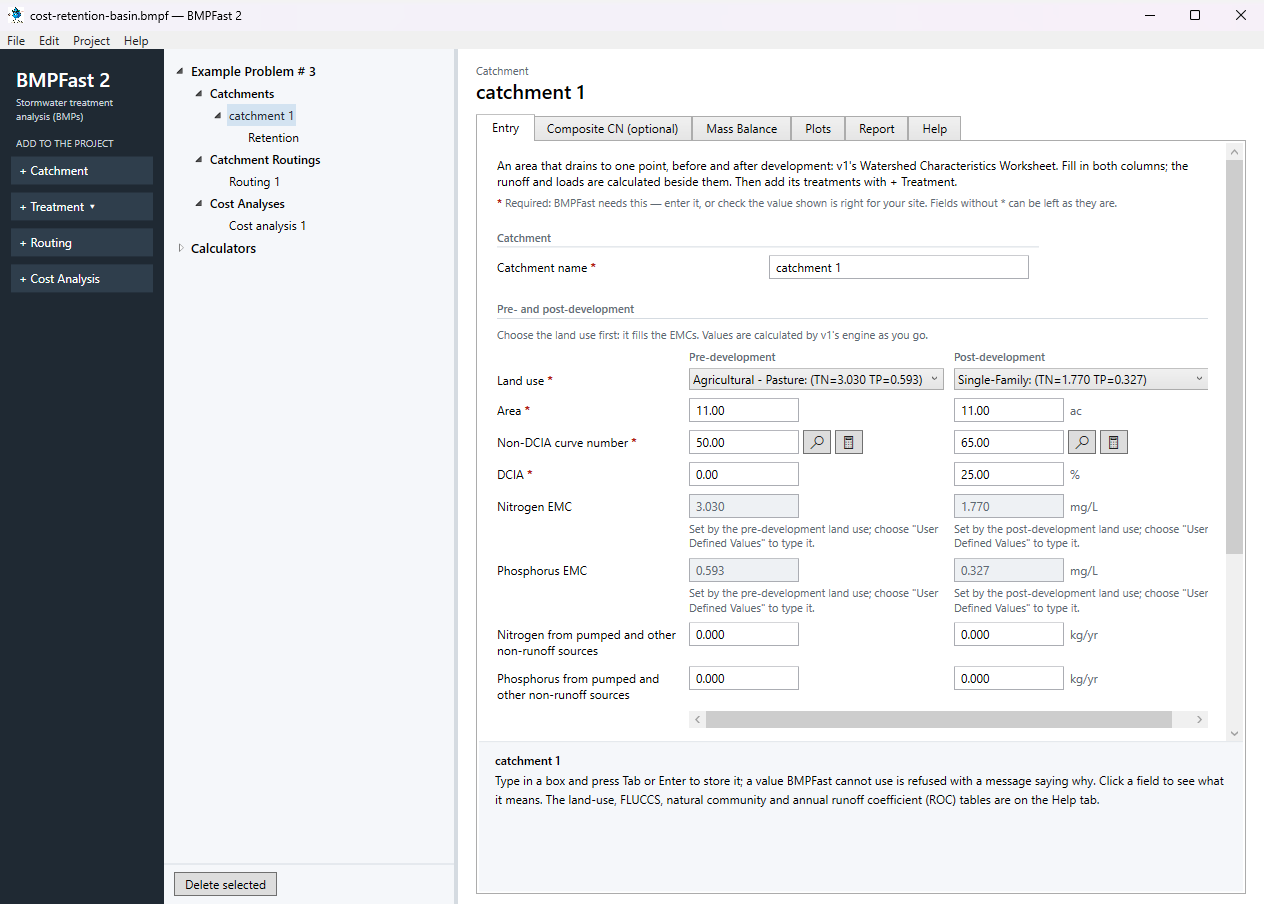
The catchment catchment 1: its Entry tab. With catchment 1 selected, press Add Treatment and choose Retention. On its Entry tab type the Treatment name Retention (BMPFast 2 starts it as “Retention 1”) and enter: Provided retention volume 0.506 ac-ft; Media mix None. The results are calculated as you type: Treatment depth 0.552 in; Nitrogen removal provided 75.01 %; Phosphorus removal provided 75.01 %.
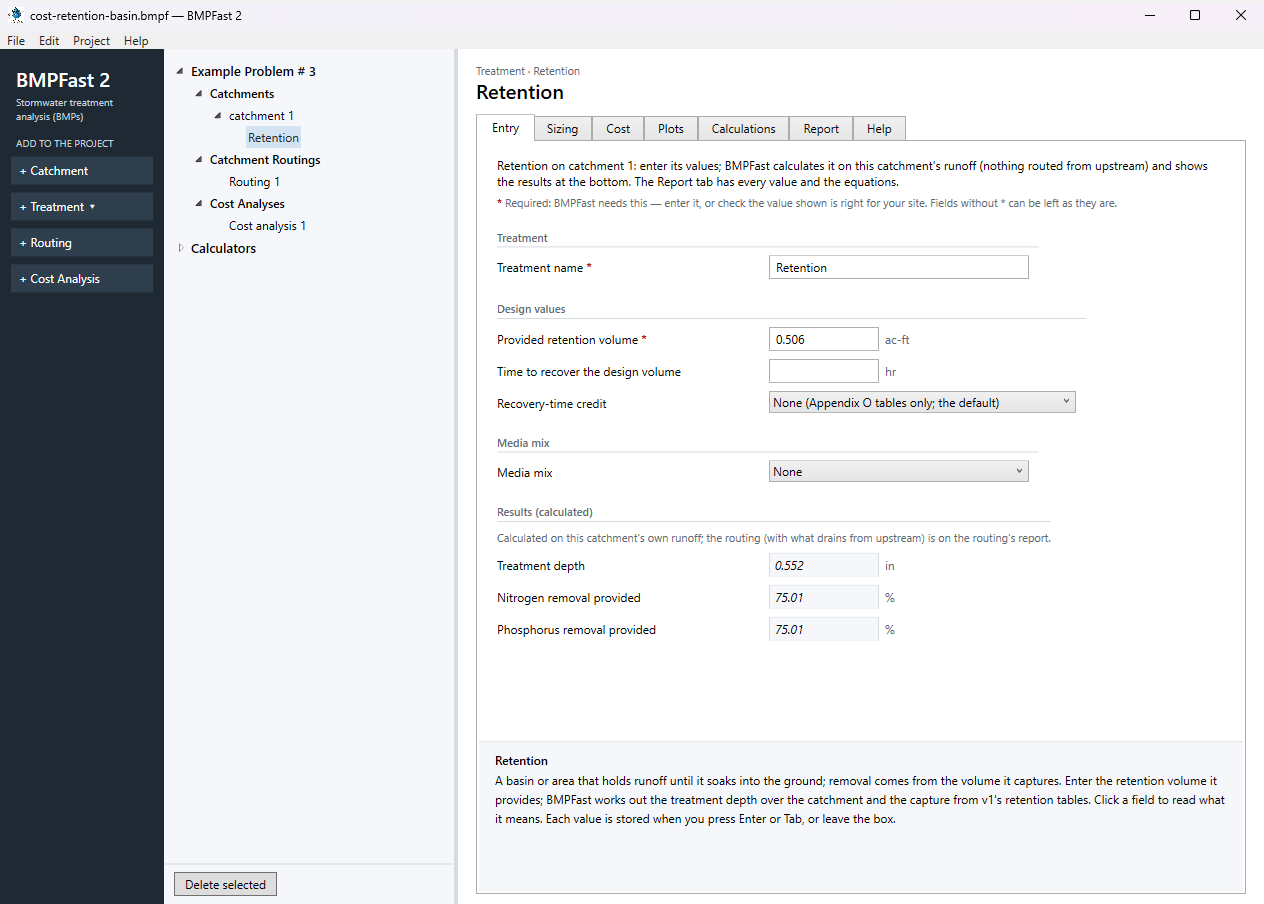
The treatment Retention: its Entry tab. Open the treatment’s Report tab: its inputs and removal, as a report to print or save.
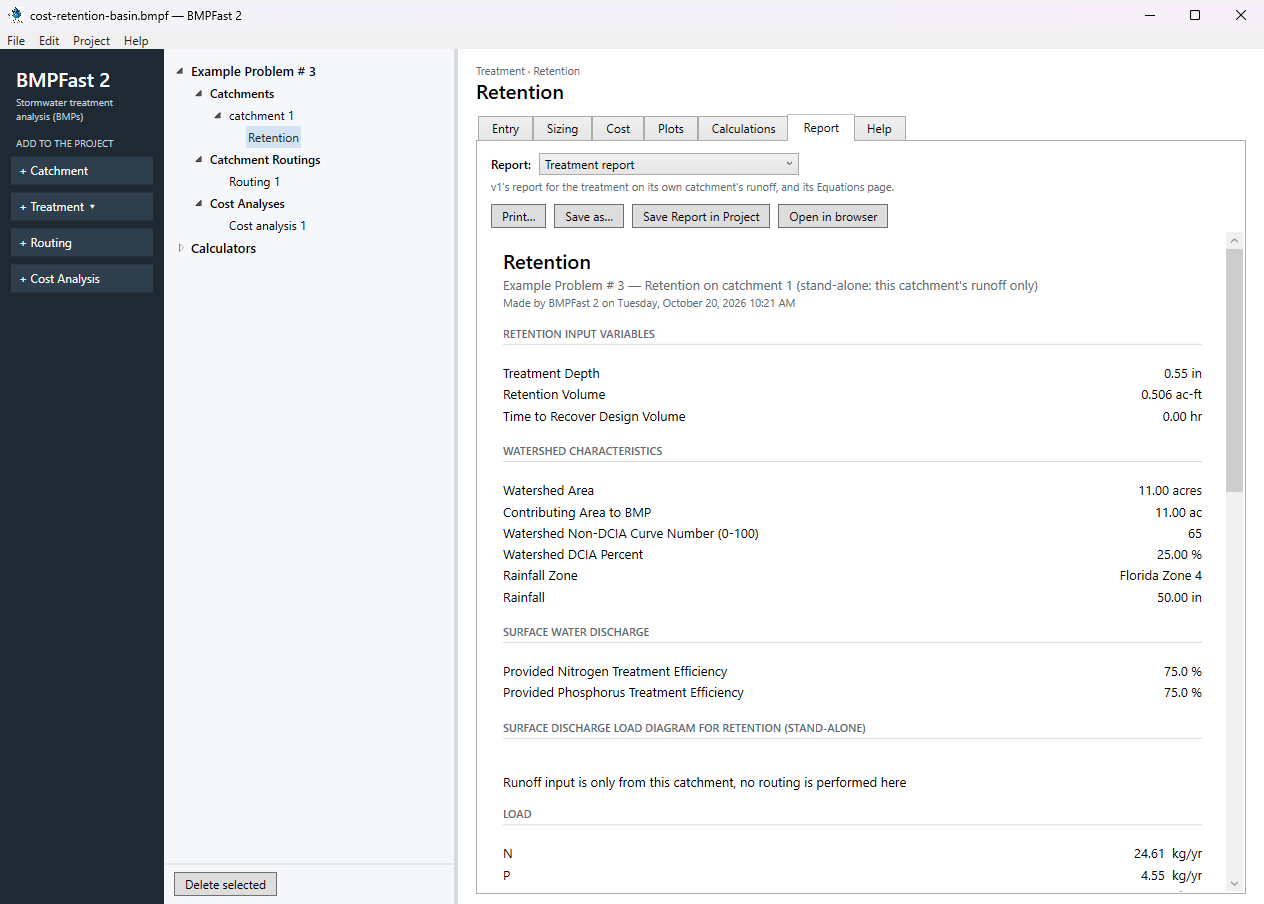
The treatment Retention: its Report tab. Press Add Routing (left). BMPFast 2 adds Routing 1 under Catchment Routings, with every catchment draining to the outlet and no treatment; a project can have several routings, compared side by side. On its Entry tab (How the routing is calculated Strand routing (v1's routing; use this for permits)) set each catchment as in this table:
Catchment Drains to Treatment used catchment 1 Outlet Retention A catchment is treated only by the treatment its routing uses.
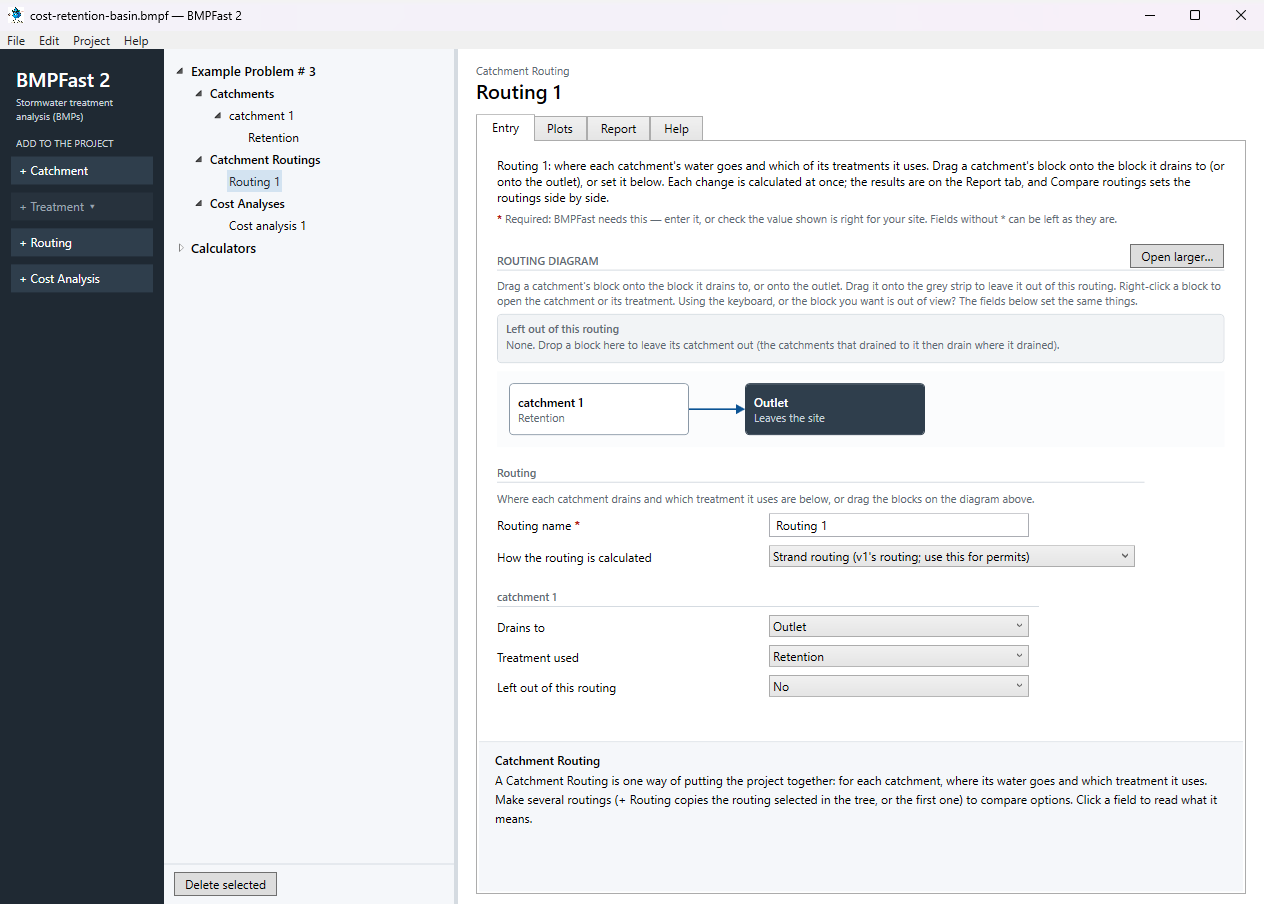
The routing’s Entry tab: where each catchment drains and the treatment it uses. Open the routing’s Report tab. Results shows the loads leaving the site, the removal provided and required, and whether the performance standard is met; the list at the top of the tab has v1’s reports for the same routing (Summary, Complete, Flow Balance, AH Vol I Sec 9 compliance). Save the project with File ▸ Save; compare it with the .bmpf under Files.
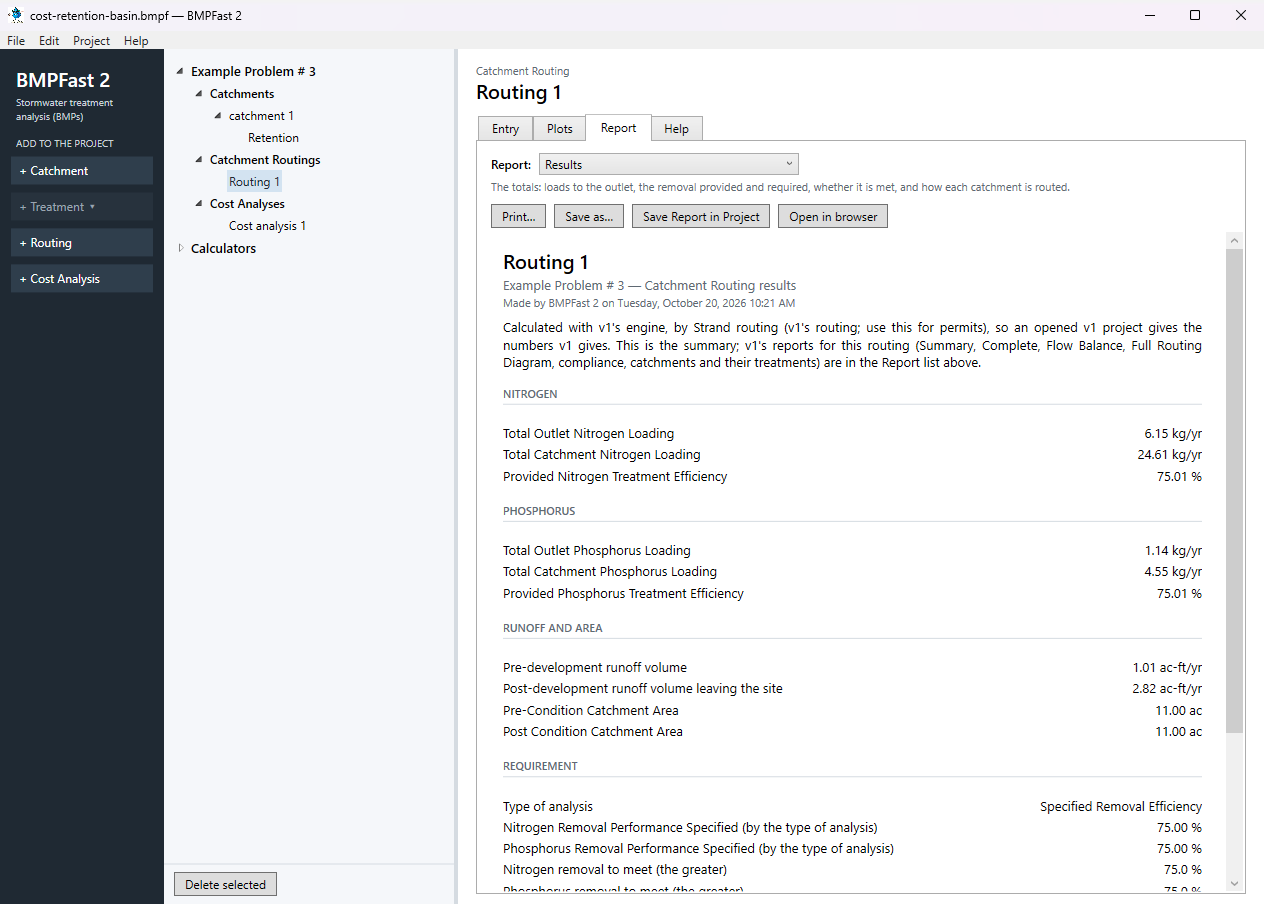
The routing’s Report tab: Results. Select the treatment Retention and open its Cost tab. Under Settings the Discount rate (3.3 %) and the Analysis period (30 years) are the project’s (also on General Site Information, Life-cycle cost); type this treatment’s Inflation rate for replacements, 2.5 %. Under Cost components choose each from Component from the cost database and press Add this component, then type its costs in the table: Retention construction $100,000 – $150,000, service life 20 years, O&M 1 – 6 % a year; Outlet Structure, Fixed construction $10,000 – $15,000, service life 60 years, O&M 0.03 – 0.4 % a year. Under Routine maintenance add, from the cost database, Mowing / Vegetation Control / Litter Removal, 2 each at $1,850 a unit.
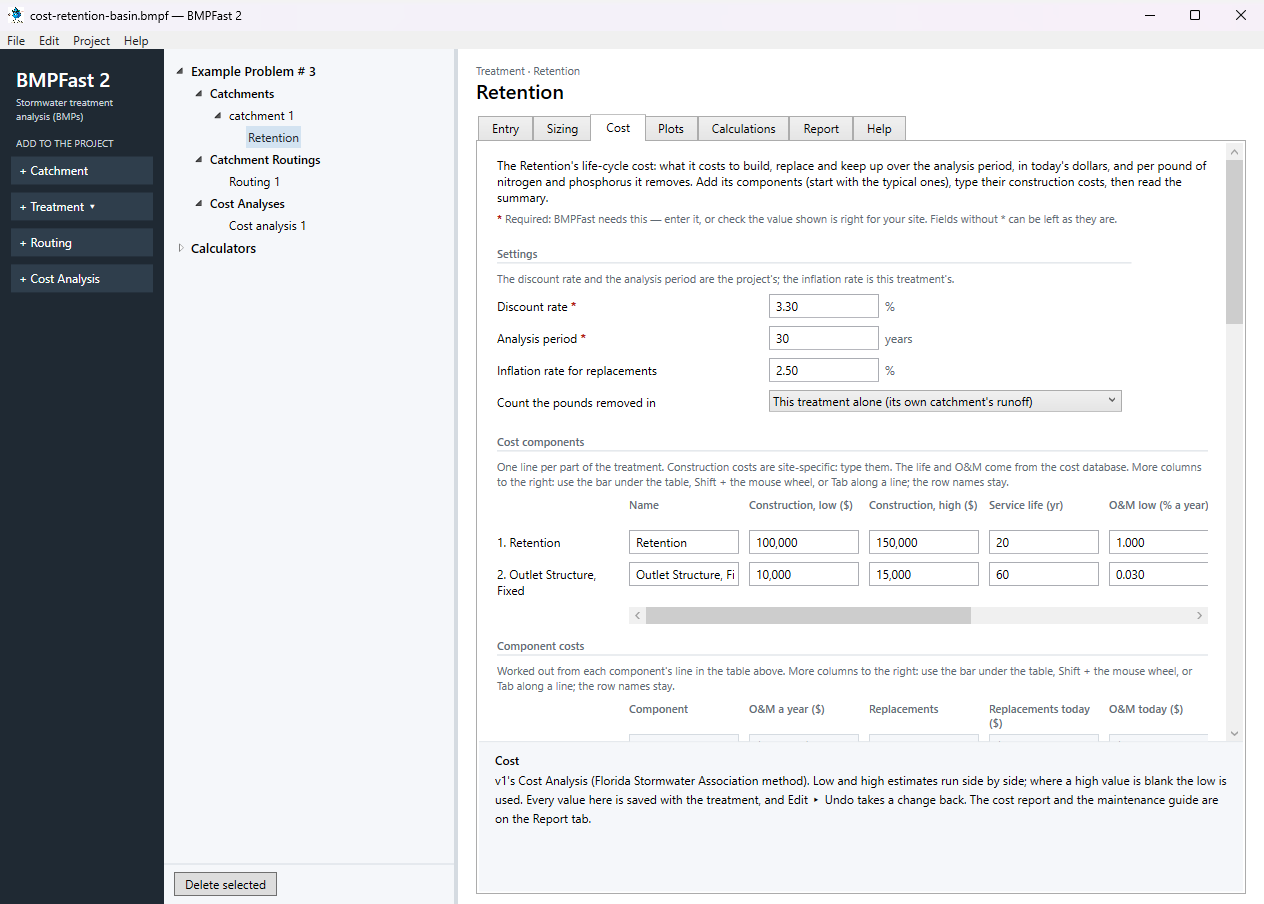
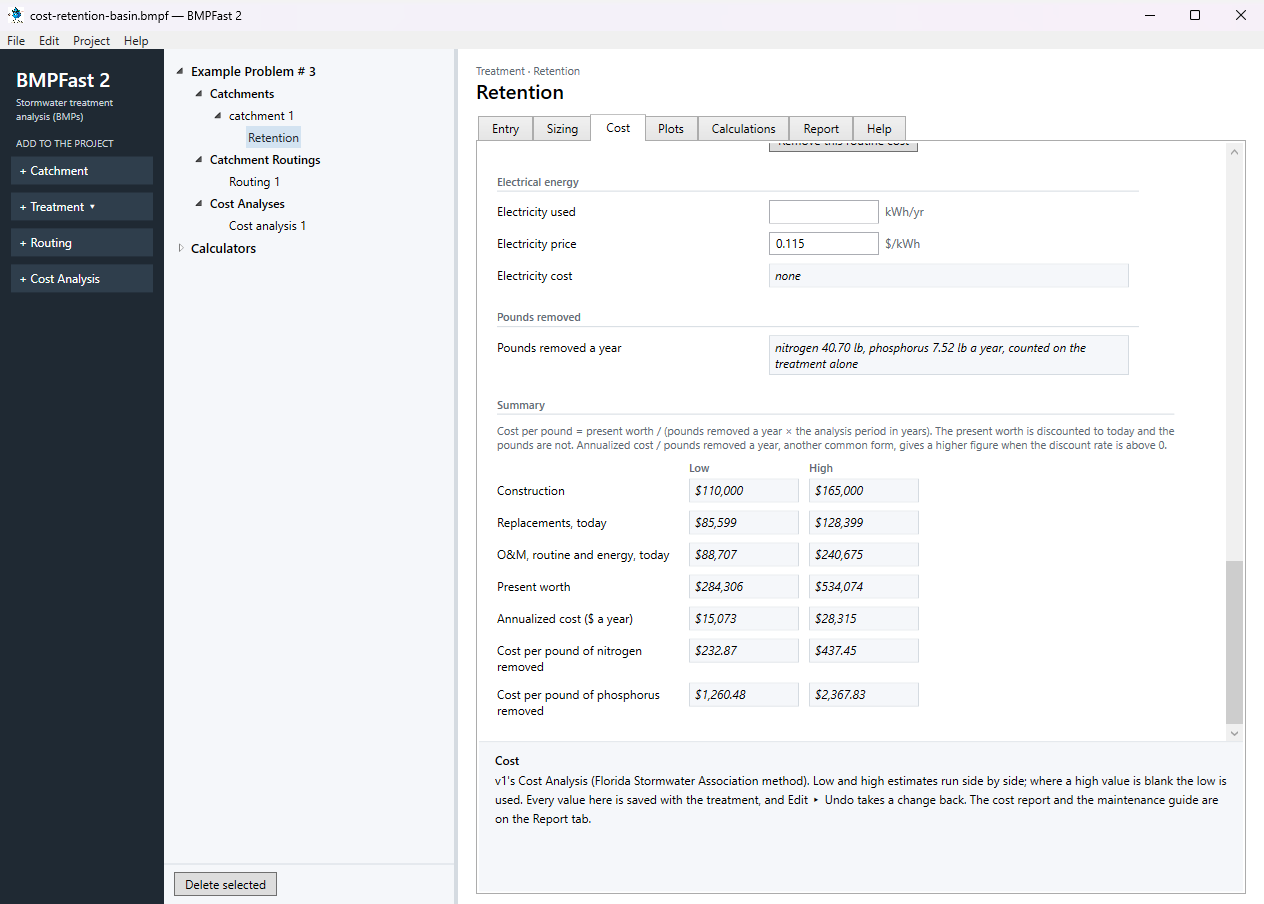
The treatment’s Cost tab: settings, components and routine maintenance. Scroll to the bottom of the Cost tab. Pounds removed says what is counted: 40.70 lb of nitrogen and 7.52 lb of phosphorus a year, on the treatment alone (choose a routing in Count the pounds removed in to count them there). The Summary gives the present worth, $284,306 – $534,074, the annualized cost and the cost per pound (the results below).
The bottom of the Cost tab: pounds removed and the summary. Press Add Cost Analysis (left): Cost analysis 1 appears under Cost Analyses. On its Entry tab choose Routing 1 as the routing costed; the discount rate and period start at the project’s. Its table, v1’s Cost Hub, has a line for each treatment the routing uses, with its present worth, annualized cost and cost per pound, and the project totals; Enter costs on a line opens that treatment’s Cost tab.
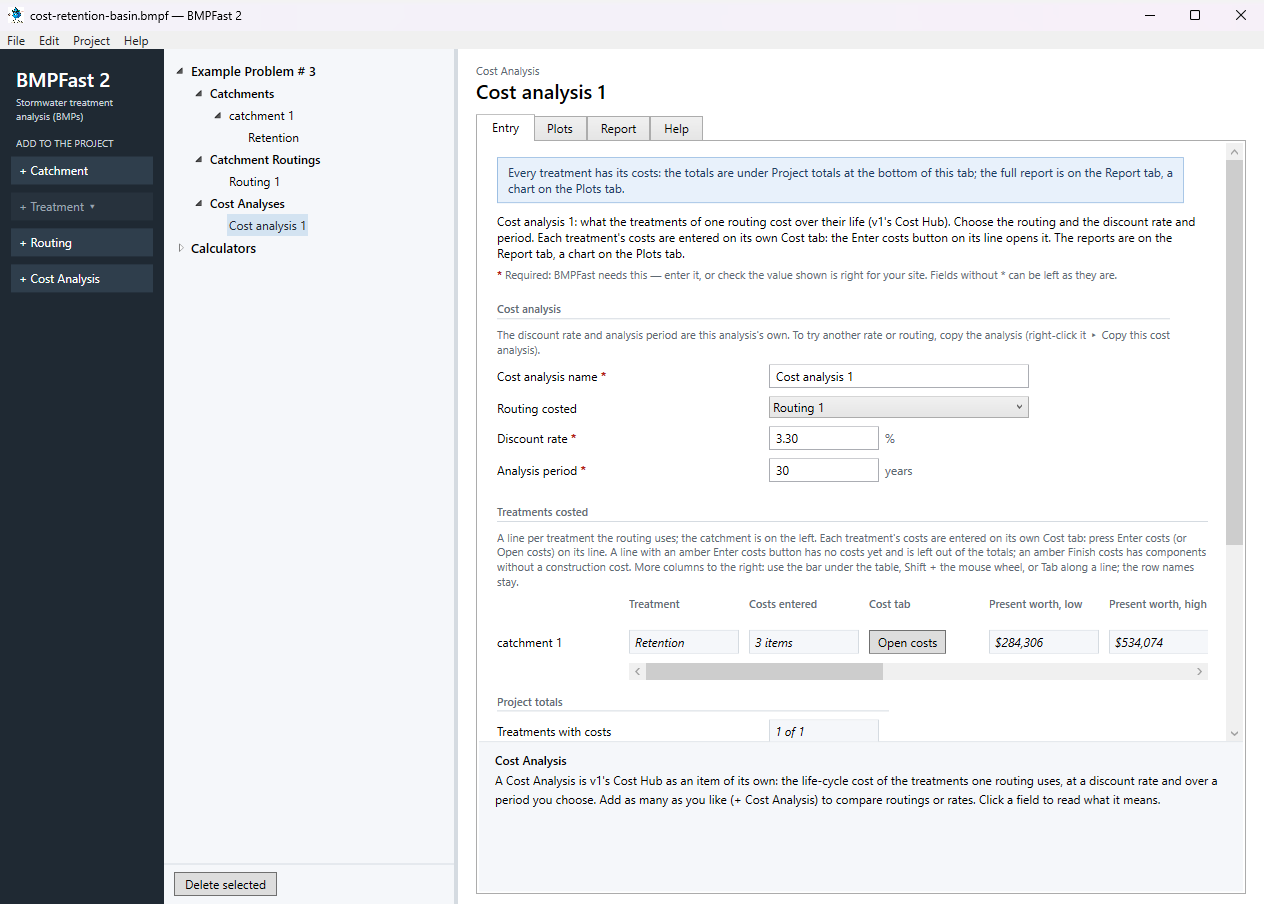
The Cost Analysis: its Entry tab (v1’s Cost Hub). Open the Cost Analysis’s Report tab: the list at its top has the table, v1’s Cost summary (Unit Cost Summary) and v1’s Full cost report, worked out at this analysis’s rate and period.
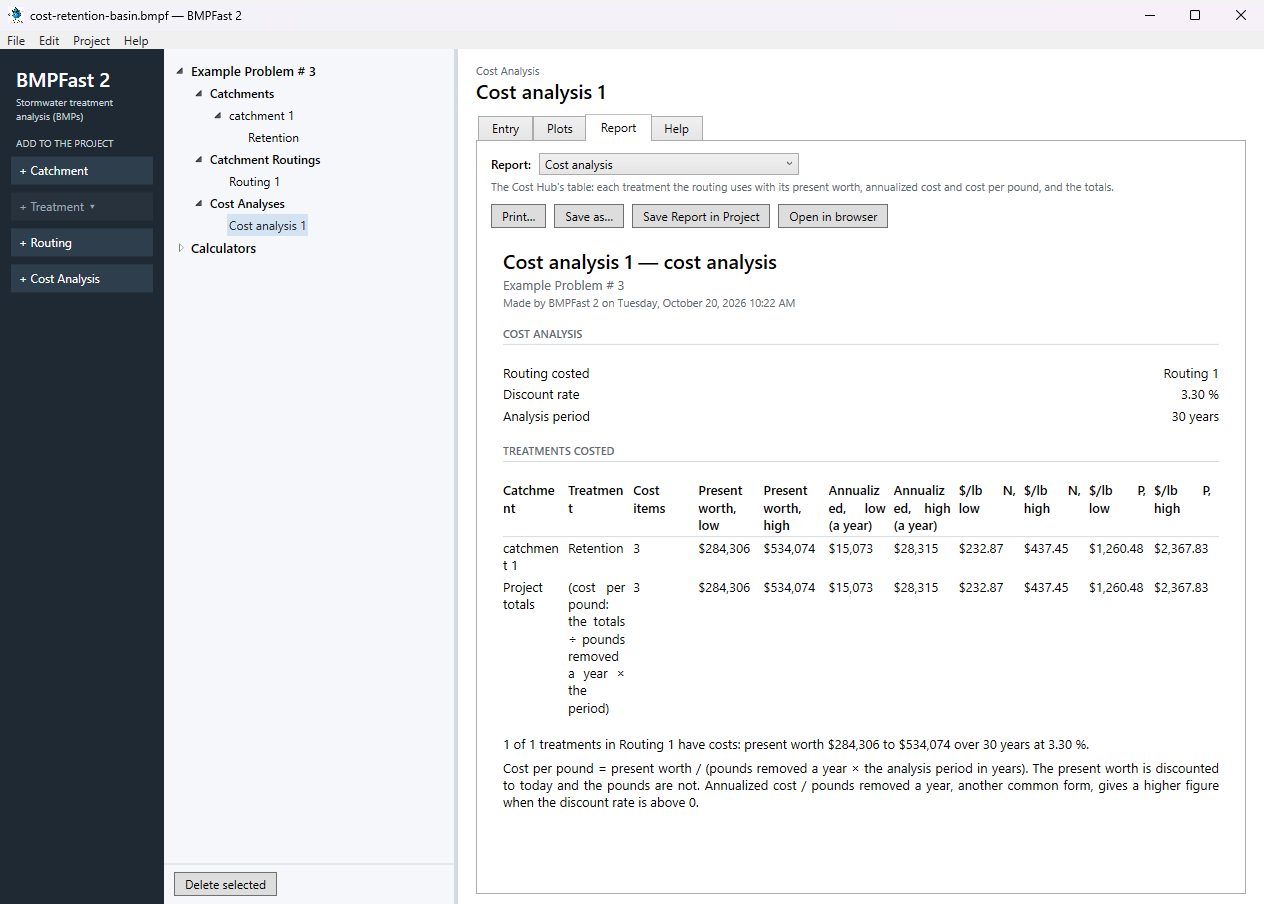
The Cost Analysis: its Report tab.
3Results
| Result, low – high (the Cost tab) | BMPFast 2 | BMPFast (v1) |
|---|---|---|
| Construction | $110,000 – $165,000 | $110,000 – $165,000 same |
| Replacements, today | $85,599 – $128,399 | $85,599 – $128,399 same |
| O&M, routine and energy, today | $88,707 – $240,675 | $88,707 – $240,675 same |
| Present worth | $284,306 – $534,074 | $284,306 – $534,074 same |
| Annualized cost ($ a year) | $15,073 – $28,315 | $15,073 – $28,315 same |
| Cost per pound of nitrogen removed | $232.87 – $437.45 | $232.87 – $437.45 same |
| Cost per pound of phosphorus removed | $1,260.48 – $2,367.83 | $1,260.48 – $2,367.83 same |
| Nitrogen / phosphorus removed | 40.70 / 7.52 lb/yr | 40.70 / 7.52 lb/yr same |
The Cost Analysis (v1’s Cost Hub)
| Treatment | Cost items | Present worth | Annualized ($ a year) | $/lb N, low |
|---|---|---|---|---|
| Retention | 3 | $284,306 – $534,074 | $15,073 – $28,315 | $232.87 |
| Project totals | $284,306 – $534,074 |
The treatment’s cost report (its Report tab)
Open this report on its own page.
v1’s Full Cost Report
Open this report on its own page.
The Summary Report
Open this report on its own page.
BMPFast 2 and BMPFast (v1)
| Result | BMPFast 2 | BMPFast (v1), its page | |
|---|---|---|---|
| Nitrogen leaving the site | 6.150 kg/yr | 6.150 kg/yr | same |
| Phosphorus leaving the site | 1.136 kg/yr | 1.136 kg/yr | same |
| Site removal, nitrogen | 75.006 % | 75.006 % | same |
| Site removal, phosphorus | 75.006 % | 75.006 % | same |
| catchment 1: Retention removal, nitrogen | 75.006 % | 75.006 % | same |
| catchment 1: Retention removal, phosphorus | 75.006 % | 75.006 % | same |
Every number BMPFast 2 gives for this problem is the same as BMPFast (v1)’s, to three decimals.
4Check
| Present worth | = construction + replacements today + O&M today |
| = 110,000 + 85,599 + 88,707 | |
| = $284,306 (low; BMPFast 2 $284,306). |
| Annualized cost | = present worth × capital recovery factor |
| CRF | = i(1+i)N / ((1+i)N − 1) |
| = 0.05302 at i | |
| = 3.3 %, N | |
| = 30 |
$15,073 a year (BMPFast 2 $15,073).
| Cost per pound | = present worth / (pounds removed a year × years) |
| = 284,306 / (40.70 lb/yr × 30) | |
| = $232.87 per lb of nitrogen (BMPFast 2 $232.87). |
The Cost tab says the same under its Summary (Cost Analysis Methodology).
5Files
- cost-retention-basin.bmpf: the project, saved by BMPFast 2. Save it (your browser puts it in Downloads), then in BMPFast 2 choose File ▸ Open and open it. Opened again and calculated, it gives the numbers on this page.
- cost-retention-basin.bmpt: the same project as BMPFast (v1) saved it. BMPFast 2 opens it too (File ▸ Open); saving it then makes a .bmpf and leaves the .bmpt as it was.
- Routing 1 (BMPFast 2’s report, as Open in browser on its Report tab gives it)
- Routing 1 — Summary Report (BMPFast 2’s report, as Open in browser on its Report tab gives it)
- Retention (BMPFast 2’s report, as Open in browser on its Report tab gives it)
- Retention — calculations (BMPFast 2’s report, as Open in browser on its Report tab gives it)
- Retention — cost report (BMPFast 2’s report, as Open in browser on its Report tab gives it)
- Cost analysis 1 — cost analysis (BMPFast 2’s report, as Open in browser on its Report tab gives it)
- Cost analysis 1 — Full cost report (BMPFast 2’s report, as Open in browser on its Report tab gives it)
6Help and methodology
Calculated with BMPFast 2 version 2.0.0 (2026-10-20), which opens the problem’s v1 project as it is. Screen captures are of BMPFast 2’s own window and are for demonstration only.