
All programs › BMPFast › Sample problems
Wet detention pond with a littoral zone
A 4.0 ac-ft permanent pool with a littoral zone; All sites non-exempted, Zone 2.
Help: Wet Detention (help page 211) · Download the .bmpt · Link to Solution in BMPFast Version 2
1The problem
The same 10-acre subdivision drains to a wet detention pond with a permanent pool of 4.0 ac-ft and a littoral zone.
| Input | Value | Source |
|---|---|---|
| Project (General Site Information) | ||
| Meteorological zone | Florida Zone 2 | Zone map (help page 815) |
| Mean annual rainfall | 50 in | Mean annual rainfall map (help page 815) |
| Performance standard (analysis type) | All sites non-exempted | Site (illustrative) |
| Catchment 1: Subdivision (Watershed Characteristics) | ||
| Land use, pre / post | Agricultural - Pasture / Single-Family | Site (illustrative) |
| Area, pre / post | 10 / 10 ac | Site (illustrative) |
| Non-DCIA curve number, pre / post | 61 / 75 | Site (illustrative) |
| DCIA, pre / post | 0 / 25 % | Site (illustrative) |
| EMC TN, pre / post | 3.030 / 1.770 mg/L | BMPFast land use table (AH Vol I Table 9.2) |
| EMC TP, pre / post | 0.593 / 0.327 mg/L | BMPFast land use table (AH Vol I Table 9.2) |
| Wet Detention (worksheet) | ||
| Permanent Pool Volume | 4.0 ac-ft | Design (illustrative) |
| Check if there is a littoral zone | ticked | Design (illustrative) |
| Floating Wetland or other MAPs Credit | 0 % | Design (illustrative) |
Find: the TN and TP removal of the BMP, the loads leaving the site, and whether the performance standard is met.
2Steps in BMPFast
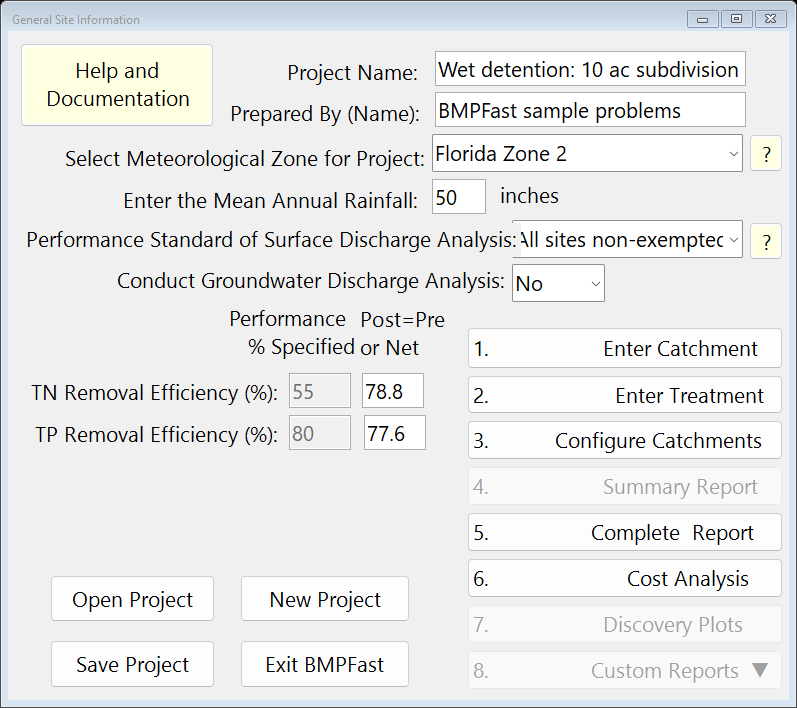
Press New Project. On General Site Information (the main window; its title bar reads General Site Information and your license key) type the project name Wet detention: 10 ac subdivision, choose Florida Zone 2, enter 50 in of mean annual rainfall and choose the performance standard All sites non-exempted.
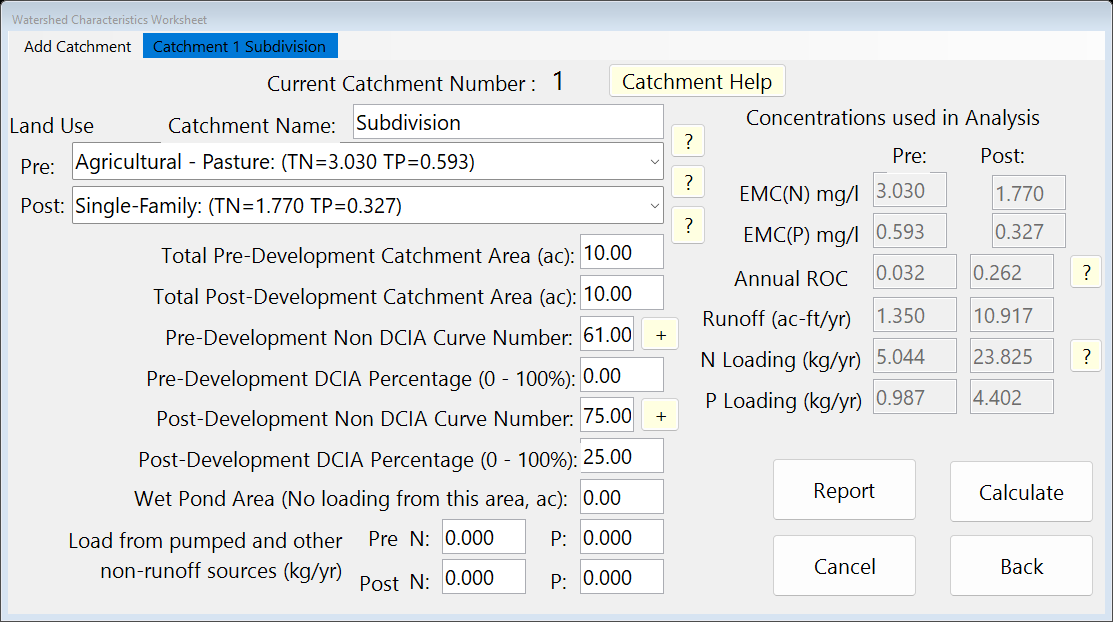
General Site Information (the main window). Press 1. Enter Catchment. For Catchment 1 type the name Subdivision, choose the land uses Agricultural - Pasture (pre) and Single-Family (post), enter the areas 10 and 10 ac, the non-DCIA curve numbers 61 and 75 and the DCIA 0 and 25 %, then press Calculate. BMPFast shows the annual runoff coefficient, the runoff and the TN and TP loads. Press Back.
Watershed Characteristics Worksheet (1. Enter Catchment). Press 2. Enter Treatment and then Wet Detention. On the Wet Detention worksheet: Permanent Pool Volume 4.0 ac-ft; tick Check if there is a littoral zone; Floating Wetland or other MAPs Credit 0 %. Press Calculate. The report on the worksheet shows the inputs and the results.
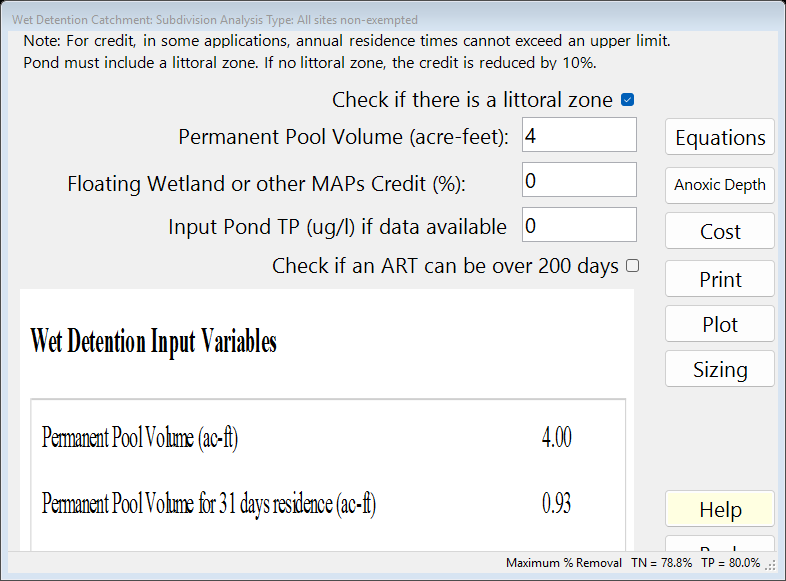
The BMP worksheet after Calculate: the report on the left. Press the same button again, now labelled Equations: the worksheet shows each equation with this problem’s values. Press Back to return to the treatment options.
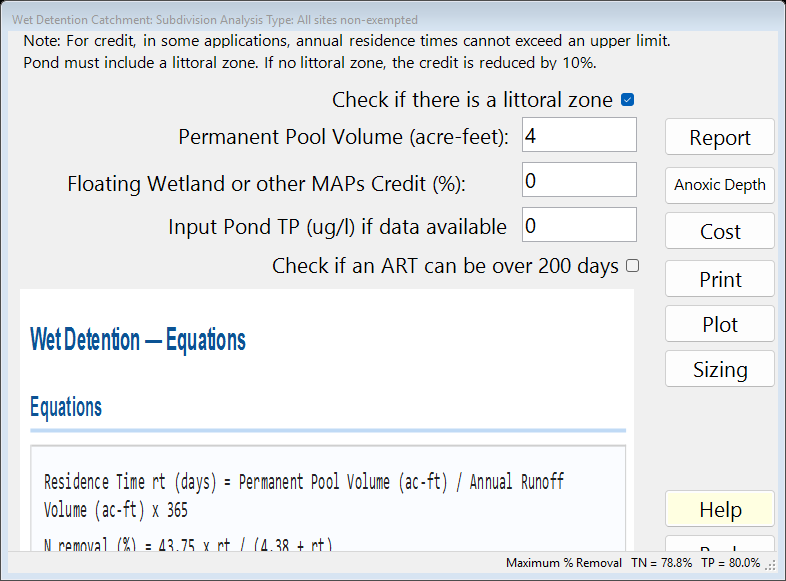
The same worksheet showing Equations: each equation with this problem’s values. On the main window press 3. Configure Catchments and double-click Catchment 1. Choose Wet Detention as the BMP used in routing and the Outlet as where it goes. Press Back twice. (A catchment’s BMP is only used once it is chosen here.)
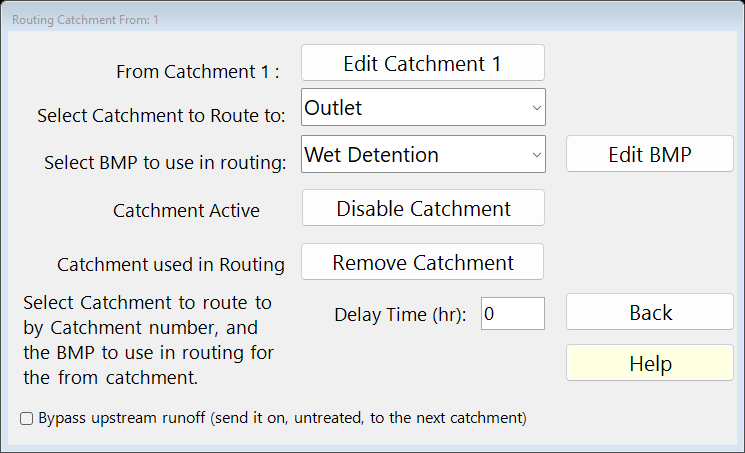
Routing for Catchment 1 (3. Configure Catchments): the BMP used and where the catchment goes. Press 4. Summary Report. The Report Viewer shows the loads, the removal and whether the performance standard is met. Press Save Project to keep your copy; compare it with the .bmpt under Files.
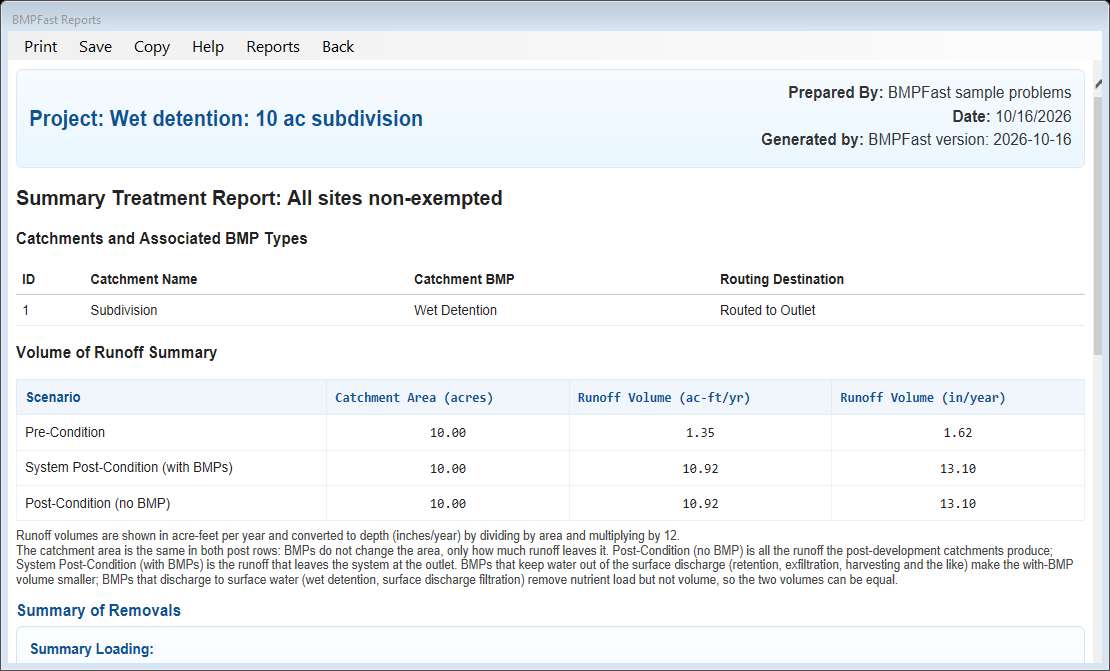
The Summary Report (4. Summary Report) in the Report Viewer.
3Results
| Result | Value |
|---|---|
| Catchment 1: computed by BMPFast | |
| Annual runoff coefficient (ROC), pre / post | 0.032 / 0.262 |
| Runoff, pre / post | 1.350 / 10.917 ac-ft/yr |
| TN load, pre / post | 5.044 / 23.825 kg/yr |
| TP load, pre / post | 0.987 / 4.402 kg/yr |
| Wet Detention: computed by BMPFast | |
| Annual residence time | 133.7 days |
| Hydraulic capture efficiency | 76.43 % |
| Provided TN / TP removal | 42.36 % / 76.43 % |
| TN load in → out | 23.825 → 13.732 kg/yr |
| TP load in → out | 4.402 → 1.037 kg/yr |
| Site (all catchments, at the outlet) | |
| TN load: catchments → outlet | 23.825 → 13.732 kg/yr |
| TP load: catchments → outlet | 4.402 → 1.037 kg/yr |
| Provided removal TN / TP | 42.4 % / 76.4 % |
| Required removal TN / TP (Maximum % Removal) | 78.8 % (not met) / 80.0 % (not met) |
The BMP report
Open this report on its own page.
The Summary Report
4Check
Runoff and loads (Equations 9-1 and 9-2 of AH Vol I).
| Runoff | = ROC × area × rainfall / 12 |
| = 0.262 × 10.00 ac × 50.0 in / 12 | |
| = 10.917 ac-ft/yr (program 10.917). |
| TN load | = EMC × runoff × 1.233 |
| = 1.770 × 10.917 × 1.233 | |
| = 23.825 kg/yr (program 23.825) |
| TP load | = 0.327 × 10.917 × 1.233 |
| = 4.402 kg/yr (program 4.402). |
1.233 kg is 1 mg/L in 1 ac-ft.
Annual residence time.
| ART | = permanent pool × 365 / annual runoff |
| = 4.000 ac-ft × 365 / 10.917 ac-ft/yr | |
| = 133.7 days (program 133.7). |
Removal. The wet detention equations of AH Vol I Appendix O at 133.7 days, with a littoral zone, give TN 42.36 % and TP 76.43 %. The worksheet’s Equations page shows each equation with these numbers; the Wet Detention Methodology explains them.
Load out.
| TN out | = load in × (1 − removal) |
| = 23.825 × (1 − 42.36 / 100) | |
| = 13.732 kg/yr (program 13.732) |
| TP out | = 4.402 × (1 − 76.43 / 100) |
| = 1.037 kg/yr (program 1.037). |
The standard is not met, and that is expected. “All sites non-exempted” requires the greater of 55 % TN and 80 % TP, or the removal that keeps the post-development load at the pre-development load (Equation 9-3) (AH Vol I 8.3.2). The post = pre removal (Equation 9-3, (post load − pre load) / post load) is TN 78.8 % and TP 77.6 %. BMPFast takes the larger of the standard’s percentage and the post = pre removal as the Maximum % Removal, shown on every worksheet’s status bar and in the Summary Report: here TN 78.8 % and TP 80.0 %. This problem shows what this design removes (42.4 % / 76.4 %), which is less. To meet it, add BMPs in series or downstream catchments (see BMPs in Series and Routing), or size the BMP (see Sizing).
The program’s Equations page
5Files
- wet-detention-littoral.bmpt: the project, saved by BMPFast. Save it (your browser puts it in Downloads). In BMPFast press Open Project, then Open Project again in the Open BMPFast Project dialog (below its Recent Projects list), and choose the file.
- Equations page (worksheet) (as BMPFast shows it)
- Summary Report (as BMPFast shows it)
- BMP report (worksheet) (as BMPFast shows it)
6Help and methodology
Calculated with BMPFast 1.1.9 (build 6.0.0, 2026-10-16). Older versions may not have the Equations button or may give slightly different results; download the latest at bmpfast.com. Screen captures are for demonstration only.