
Retention curves
How much of a year's runoff a retention BMP holds back, by treatment depth, curve number and DCIA: BMPFast's tables as 3D plots for each of Florida's rainfall zones.
What the retention curves are
A retention BMP (a dry retention basin, an exfiltration trench, a swale with infiltration, pervious pavement, and the others that hold runoff and let it soak into the ground) removes nitrogen and phosphorus by not discharging the water that carries them. How much of a year's runoff it holds back depends on four things, and BMPFast reads it from one set of tables:
- Treatment depth (inches): the volume the BMP retains, spread over its catchment. 1 in over 10 acres is 0.83 acre-feet.
- Non-DCIA curve number (30 to 98): the NRCS (SCS) runoff curve number of the part of the catchment that is not directly connected impervious area, that is, how readily its pervious and disconnected impervious ground sheds rain. Sandy soils and lawns are low; clay and compacted ground are high.
- DCIA (%): the share of the catchment that is directly connected impervious area, such as roads, parking and roofs draining straight to the BMP.
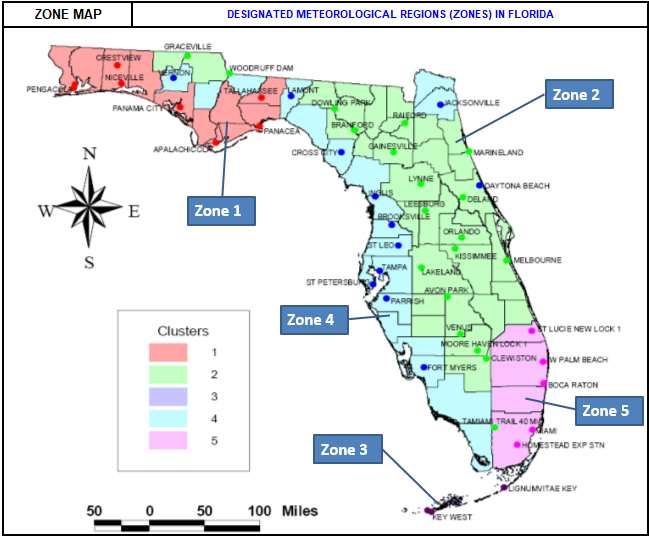
- Rainfall zone: Florida's five meteorological zones, each with its own rainfall record and so its own tables.
Each zone page draws these tables as a 3D surface: removal efficiency up, the non-DCIA curve number across and the DCIA into the page, one surface for each treatment depth from 0.25 to 4 in. Pick a depth and the plot shows its surface in colour, with the other depths faint behind it; type a curve number and a DCIA and it marks the design, its removal, and the line of every other design the same depth treats as well.
Two things to look for. Most of the removal comes from the first inch or so of retention, and each further inch adds less. And the curve number matters most where there is little DCIA: in Zone 1 at 1 in and 15 % DCIA, curve number 50 gives 88.8 % and curve number 70 gives 77.5 %, while at 95 % DCIA curve number 70 gives 61.3 %.
Choose a zone
- Florida Zone 1 The western Panhandle and the Gulf coast of the Big Bend: Pensacola, Crestview, Niceville, Panama City, Apalachicola, Tallahassee and Panacea.
- Florida Zone 2 North and central Florida, from the Georgia line to Lake Okeechobee: Jacksonville, Gainesville, Daytona Beach, Orlando, Melbourne, Lakeland, Avon Park and Clewiston.
- Florida Zone 3 The Florida Keys: Key West and Lignumvitae Key.
- Florida Zone 4 The west coast and the inland Big Bend: Cross City, Inglis, Brooksville, Tampa, St. Petersburg, Parrish and Fort Myers.
- Florida Zone 5 The southeast coast: St. Lucie Lock, West Palm Beach, Boca Raton, Miami and Homestead.
In BMPFast
BMPFast reads these tables for every retention BMP, from the BMP's treatment depth and its catchment's non-DCIA curve number, DCIA and zone. Its Retention Efficiency calculator looks up a single value, or finds the depth, curve number or DCIA that gives a removal. The method, with a worked example, is on the help page Retention methodology.
Where the numbers come from
These are the tables BMPFast uses
for every BMP that retains runoff, drawn here exactly as the program reads them (BMPFast's own CalculateEfficiency wrote every value).
They come from Harper, H.H. and Baker, D.M. (2007), Evaluation of Current Stormwater Design Criteria within the State of Florida,
Appendix D (report): a continuous
simulation of each zone's rainfall record with a dry basin that recovers half its volume in 24 hours and all of it in 72. The Environmental Resource
Permit Applicant's Handbook (Appendix O) uses the same tables. How BMPFast reads between the tabulated values is explained on the help page
Retention methodology.