
BMPFast uses one set of curves for every BMP that retains runoff. Water that is held and soaks into the ground is not discharged, and neither are the nitrogen and phosphorus it carries. This page explains those retention curves: what they depend on, where the program gets each input, what the result means, how the program reads a value between the tabulated points, and what the curves look like in each of Florida’s five meteorological zones.
The curves are used by Retention, Exfiltration, Swale, Tree Well, Rain Garden, Permeable Pavement and the Vegetated Natural Buffer (Retention). They also give the capture of a Surface Discharge Filter, the removal of retention BMPs in series (the Equivalent Treatment Depth on BMPs in Series) and the removal of retention systems in the routing.
What the curves depend on
The curves are stored as tables. For each meteorological zone and each Treatment Depth there is a table of mean annual removal (%) by Non-DCIA Curve Number (rows) and DCIA percent (columns).
| Parameter | Values in the tables | Meaning |
|---|---|---|
| Meteorological zone | Zones 1 to 5 (one set of tables each) | The rainfall pattern of the region of Florida the site is in. Each zone has its own curves. |
| Treatment Depth (in) | 0, 0.25, 0.50 … 4.00 in (17 tables per zone) | The depth of runoff the BMP retains, in inches over its contributing area. |
| Non-DCIA Curve Number | 30, 35, 40 … 95, and 98 (15 rows) | The curve number of the area that is not directly connected impervious area: how much of the rain on the pervious (and disconnected) area runs off. |
| DCIA percent (%) | 5, 10, 15 … 100 % (20 columns) | The share of the catchment that is directly connected impervious area: pavement and roofs that drain straight to the BMP. |
| Result: removal (%) | 0 to 100 | The mean annual percentage of runoff, and so of the nitrogen and phosphorus load, that is retained. |
Each table is titled “Mean Annual Mass Removal Efficiencies for d-inches of Retention for Zone z“. The values are long-term averages. A basin that retains a given depth captures all of a small storm and part of a large one, and the tables give the share of a typical year’s runoff that is captured. A site with more connected pavement (higher DCIA) or less permeable soils (higher CN) produces more runoff from the same rain, so the same depth captures a smaller share of it.
Applicant’s Handbook reference
Appendix O, Dry Retention Systems: removal is based on the runoff volume the system captures, expressed as inches over the catchment area and adjusted for the non-DCIA curve number and the DCIA, in tables titled “Mean Annual Mass Removal Efficiencies for … of Retention for Zone … by Percent DCIA”; BMPFast’s tables are these tables (0.25 to 4.00 in, Zones 1 to 5, CN 30 to 98, DCIA 5 to 100 %).
Appendix O, Table 1 (BMP Efficiencies), Retention Pond and Retention Systems: removal is “Based on percent reduction using project’s percent directly connected impervious area (DCIA), non-DCIA curve number (CN), and rainfall zone”; these are the three values BMPFast reads the curves with.
Source reference
Harper, H.H. and Baker, D.M. (2007). Evaluation of Current Stormwater Design Criteria within the State of Florida. Final report, FDEP Contract S0108, Appendix D (Calculated Performance Efficiency of Dry Retention as a Function of DCIA and Non-DCIA Curve Number) and Section 5.2.1.1 (Evaluation Methodology) (link): the retention tables come from a continuous simulation of each zone’s rainfall record, with a dry pond that recovers 50 % of its volume in 24 hours and all of it in 72 hours; BMPFast’s tables, 0.25 to 4.00 in for Zones 1 to 5, match the report value for value.
Inputs: where the program gets each value
| Input | Where it comes from |
|---|---|
| Treatment Depth | Calculated by the BMP from its own inputs. For a retention basin it is the Provided Retention Volume spread over the contributing area: Treatment Depth (in) = 12 × Volume (ac-ft) / Contributing Area (ac). Retention BMPs gives every BMP’s equation, and each BMP’s help page has its own (for example Retention). |
| Non-DCIA Curve Number | The catchment’s post-development Non-DCIA Curve Number, on Catchment Characteristics. |
| DCIA percent | The catchment’s post-development DCIA percent, on Catchment Characteristics. |
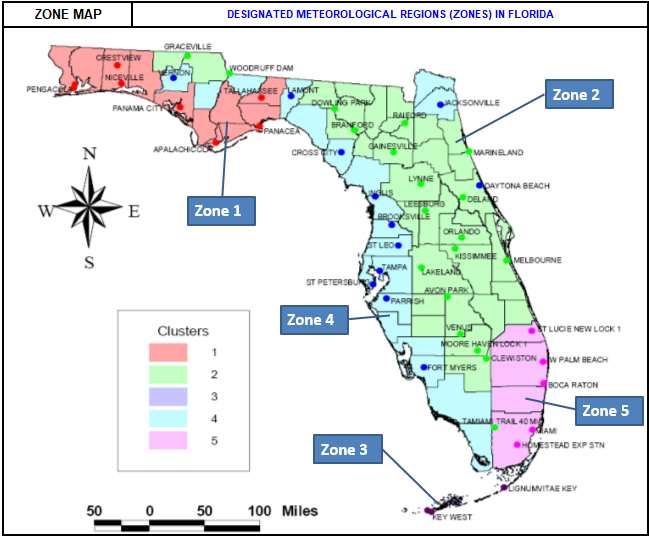
| Meteorological zone | The zone chosen on General Site Information (the “?” beside it shows the zone map; the map is also under The curves for each zone). |
Applicant’s Handbook reference
Section 9.2.1 Calculating Predevelopment and Post-development Hydrology: the meteorological zone comes from Appendix M, and the DCIA and non-DCIA curve number are found for each catchment; BMPFast takes them from General Site Information and Catchment Characteristics.
Appendix M, Figure 1 (Designated Meteorological Regions (Zones) in Florida): the five zones whose tables BMPFast uses.
Results
- Hydraulic capture (%): the value read from the curves, the mean annual percentage of runoff retained.
- Nitrogen and phosphorus removal (%): equal to the hydraulic capture for a retention BMP, because the retained water keeps its load.
- For Retention, Exfiltration and the other retention worksheets, the value is then raised by the Recovery-Time Adjustment when the design volume is recovered quickly (see Retention). Removal cannot exceed 100 %.
- Required Treatment Depth: the program also uses the curves in reverse. It searches for the Treatment Depth whose removal equals the required removal, starting at 0.25 in, stepping by 0.1 in and making the step ten times smaller each time it passes the target, until it is within 0.001 %. The reports and Sizing give this as the required depth.
Applicant’s Handbook reference
Appendix O, Dry Retention Systems: the treatment volume must be recovered within 72 hours or less, “equivalent to the volume recovery period utilized for generation of the performance efficiency summarized in the tables”; BMPFast differs: its Recovery-Time Adjustment raises the removal of a design volume recovered within 36 hours, which the handbook does not provide for.
Source reference
BMPFast method (required depth search, Storage.cs): the search for the Treatment Depth that gives the required removal is BMPFast’s; the reports and Sizing show its result.
To read a single value without building a project, use the Retention Efficiency Lookup Tables calculator. To see how a project’s removal changes with a design value, use Discovery Plots.
How the program reads between the tabulated values
Every retention calculation goes through one function, RetentionEfficiencyLookupTables.CalculateEfficiency(Treatment Depth, Non-DCIA CN, DCIA %, Zone). It interpolates in a straight line in all three directions:
- Depth tables. Find the two tabulated depths on either side of the Treatment Depth (for 1.10 in, the 1.00 in and 1.25 in tables of the site’s zone).
- Curve number. In each of the two tables, interpolate between the two rows on either side of the Non-DCIA CN, for every DCIA column.
- DCIA. In the row this gives, interpolate between the two columns on either side of the DCIA percent. This gives one removal for the lower depth (Elower) and one for the upper depth (Eupper).
- Depth. Interpolate between those two removals: Removal = Elower + (d − dlower) / (dupper − dlower) × (Eupper − Elower).
Worked example (Zone 1, Non-DCIA CN 72, DCIA 40 %, Treatment Depth 1.10 in):
| Step | 1.00 in table | 1.25 in table |
|---|---|---|
| Table values at DCIA 40 % for CN 70 and CN 75 | 76.5 and 74.2 | 81.3 and 79.3 |
| CN 72 is 0.4 of the way from 70 to 75 | 76.5 + 0.4 × (74.2 − 76.5) = 75.58 | 81.3 + 0.4 × (79.3 − 81.3) = 80.50 |
| 1.10 in is 0.4 of the way from 1.00 to 1.25 | 75.58 + 0.4 × (80.50 − 75.58) = 77.55 % | |
BMPFast returns 77.548 % for these inputs, the same as the hand calculation. (DCIA 40 % falls exactly on a column, so step 3 has nothing to interpolate here.)
Rules at the edges of the tables
- A Treatment Depth of 0 gives 0 %. Between 0 and 0.25 in the removal rises in a straight line from 0 to the 0.25 in value.
- Above 4 in the removal stays at the 4 in value: a deeper design gets no more credit from the curves.
- A DCIA percent below 5 % is read as 5 %.
- A Non-DCIA CN below 30 or above 98 is extended in a straight line from the nearest two rows of the table.
- If the deeper of the two tables gave a lower value than the shallower one, the program uses the deeper table’s value instead of interpolating, so removal never falls as the depth increases.
Applicant’s Handbook reference
Appendix O, Dry Retention Systems: “For DCIA and CN other than increments of 5, linear interpolation between the values is performed”; BMPFast interpolates the same way, and also between depth tables, which the handbook does not describe, as it does not describe the rules at the edges of the tables above.
Source reference
BMPFast method (RetentionEfficiencyLookupTables.CalculateEfficiency): interpolating between depth tables, the straight line from 0 % at 0 in, reading DCIA below 5 % as 5 %, extending past CN 30 and 98 and holding depths above 4 in at 4 in are BMPFast’s rules; the report tables stop at their edges.
Outside the tables, BMPFast 2 warns (Ron Eaglin, October 19, 2026). These reading rules are BMPFast’s own, not the handbook’s. BMPFast 2 calculates with them and shows a large red warning, OUTSIDE THE LIMITS OF THE METHODOLOGY, naming the rule it used, on the treatment, the catchment, the routing and the calculators: a Treatment Depth above 4.00 in (read at 4.00 in) or below 0.25 in (a straight line from 0 % at 0 in), a non-DCIA curve number below 30 or above 98 (the table extended in a straight line), a DCIA below 5 % (read as 5 %). A reviewer may ask for the table values.
The Recovery-Time Adjustment is optional in BMPFast 2 (Ron Eaglin, October 19, 2026): the choice Recovery-time credit on Retention, Exfiltration and Permeable Pavement is off by default, so the removal matches Appendix O; it is BMPFast’s own credit and no published source has been found for its curves.
The curves for each zone
The map shows where each zone is. It is the map BMPFast shows with the “?” beside the zone on General Site Information (Zones button).
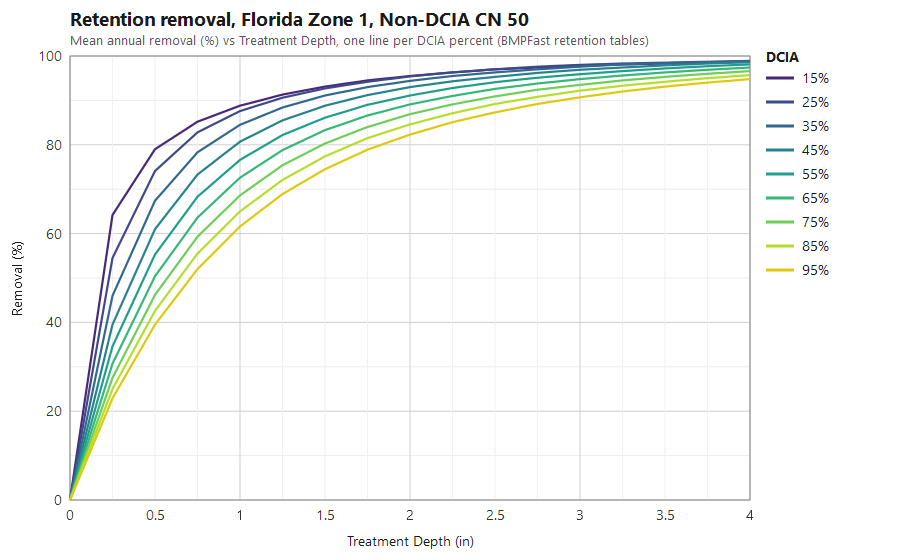
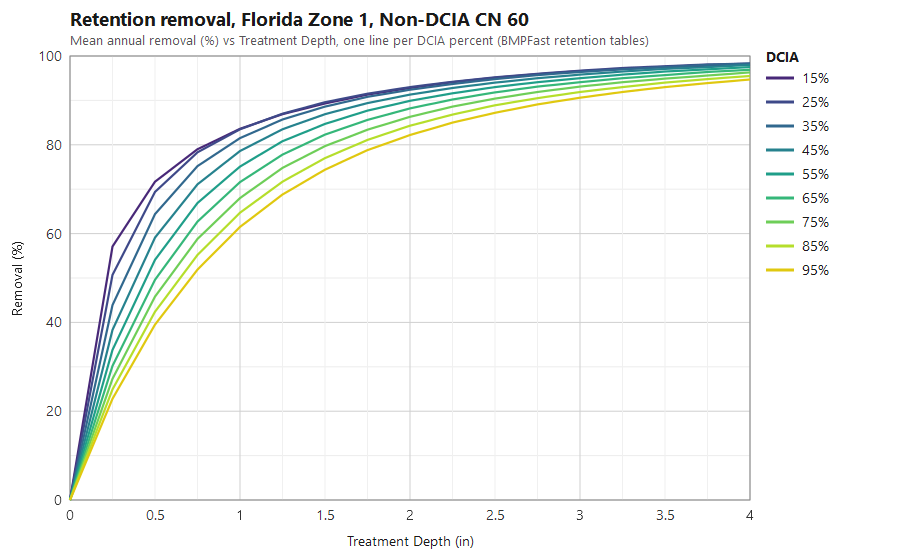
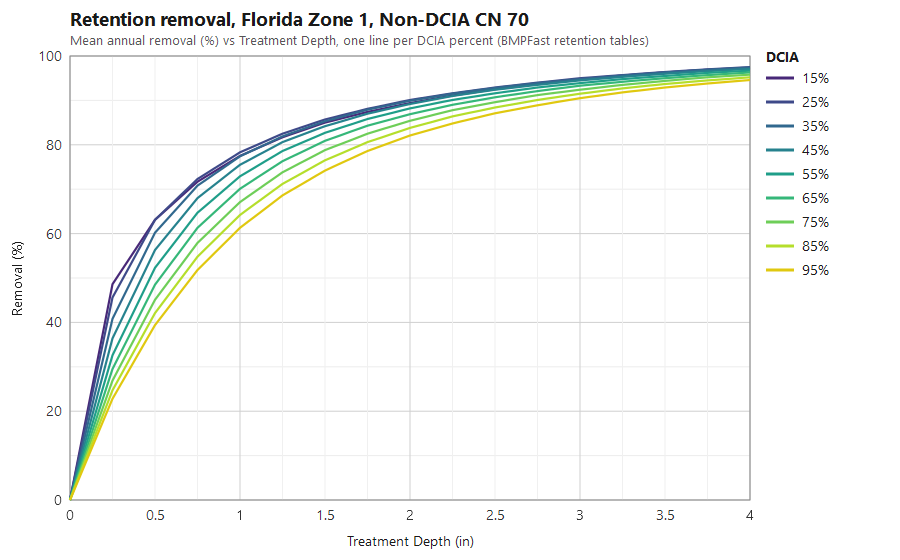
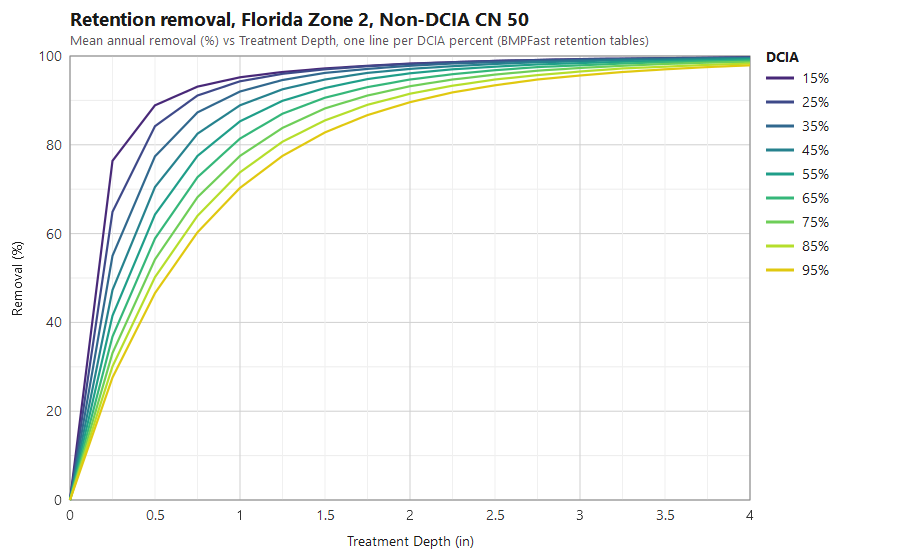
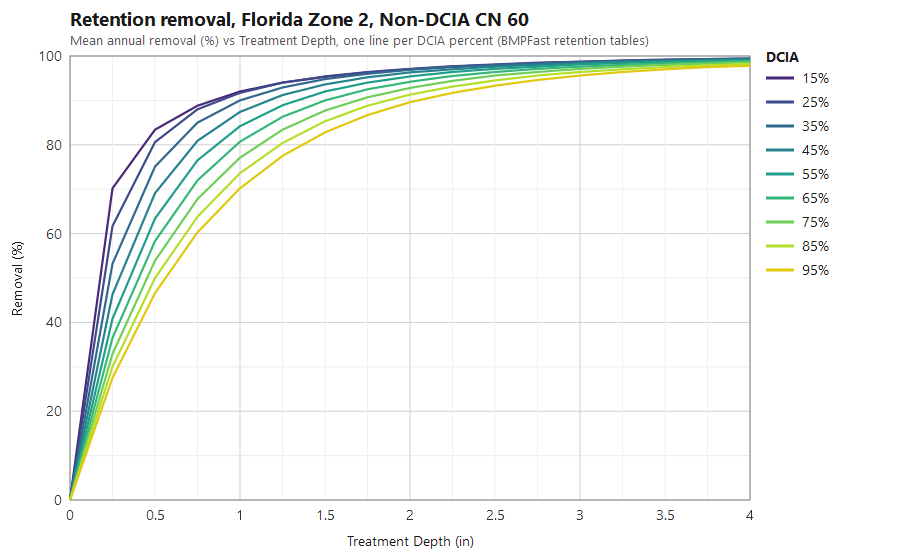
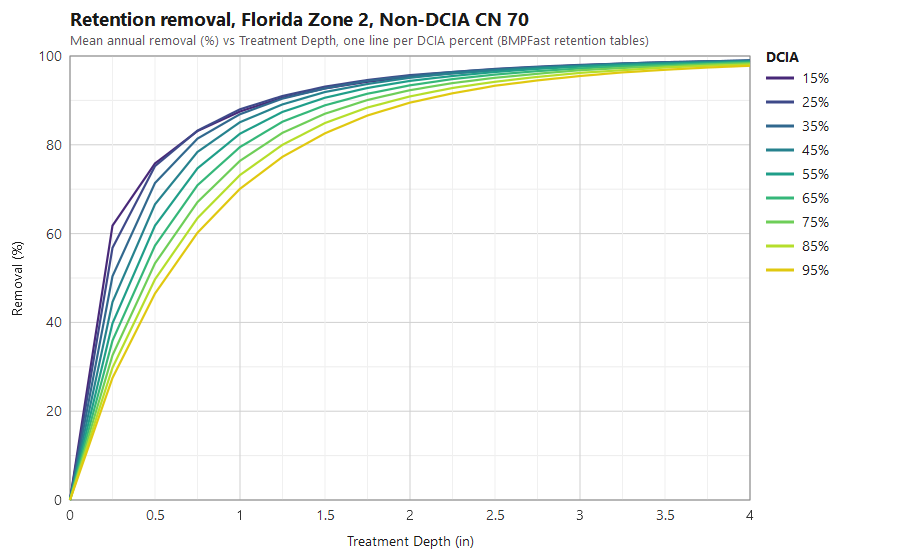
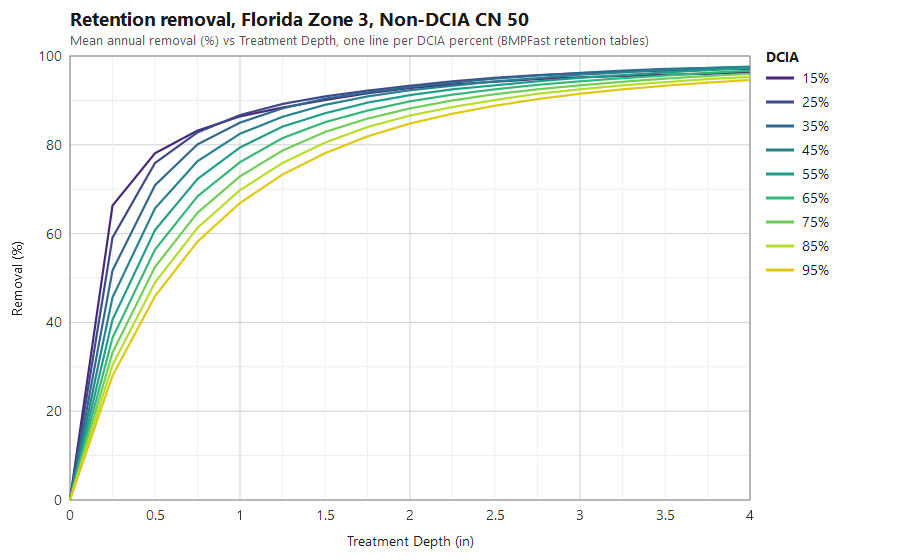
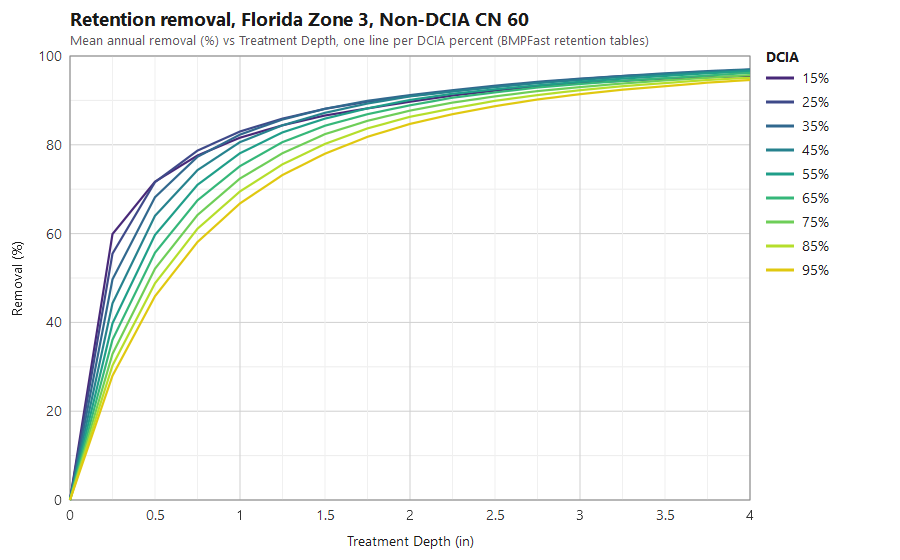
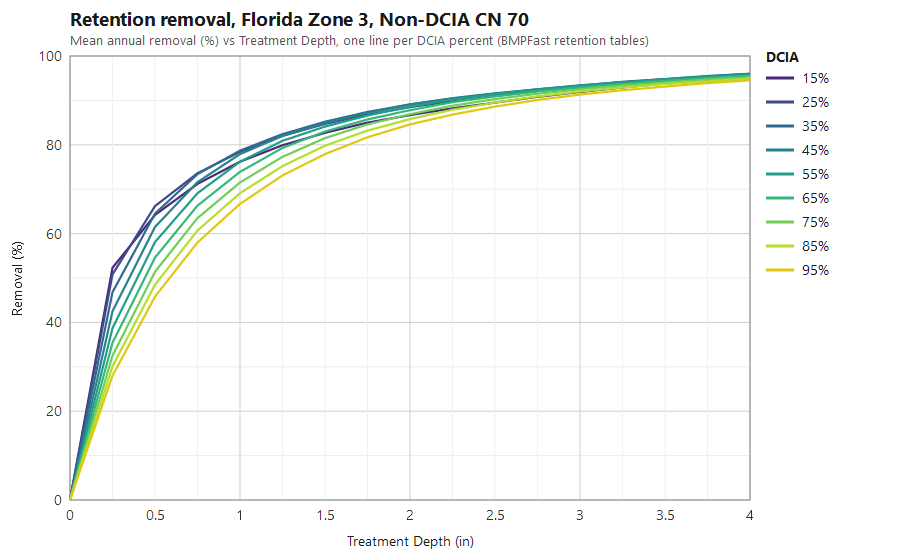
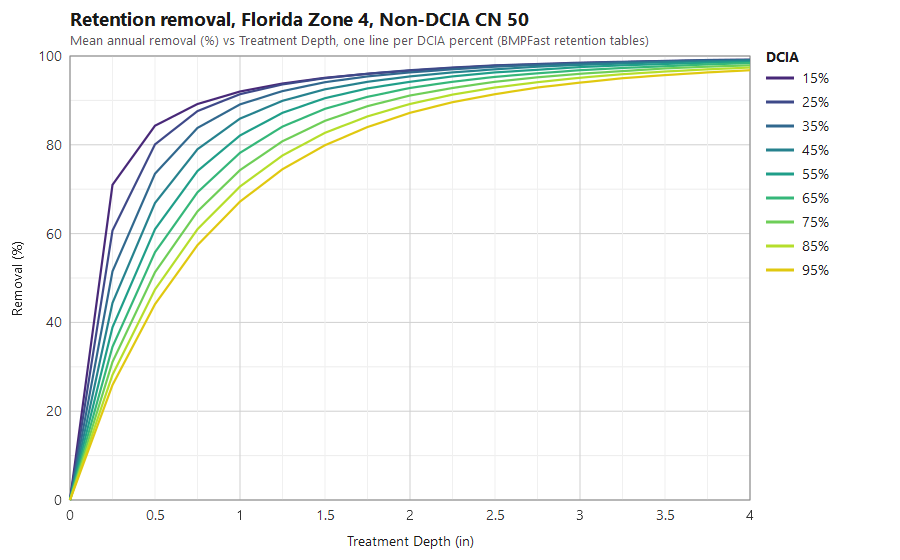
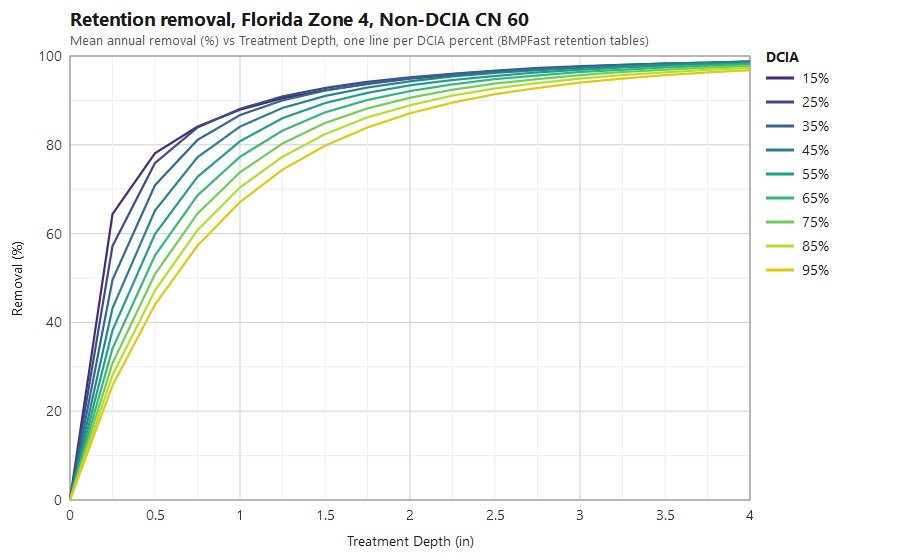
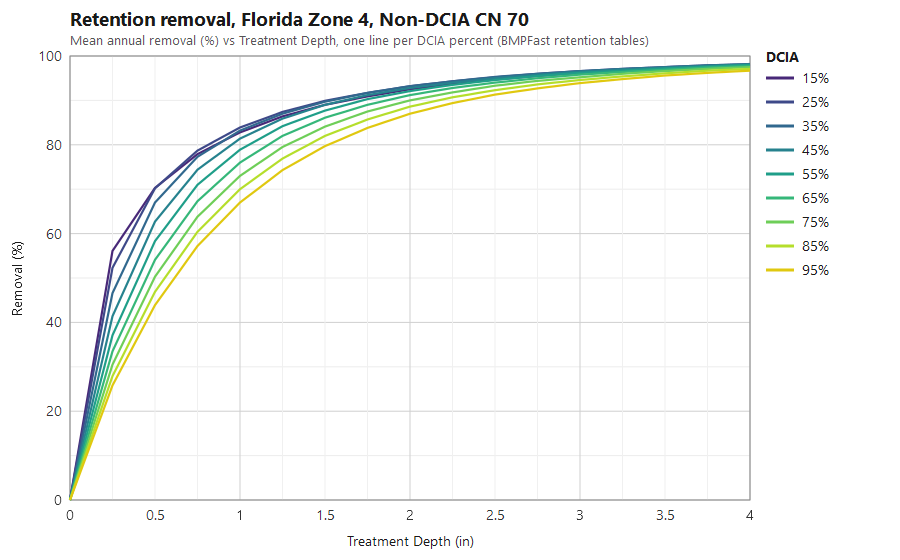
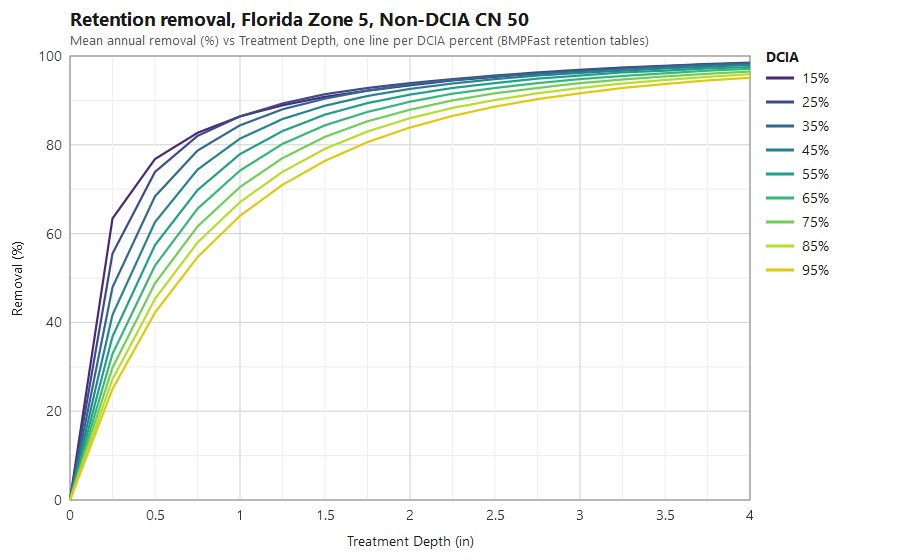
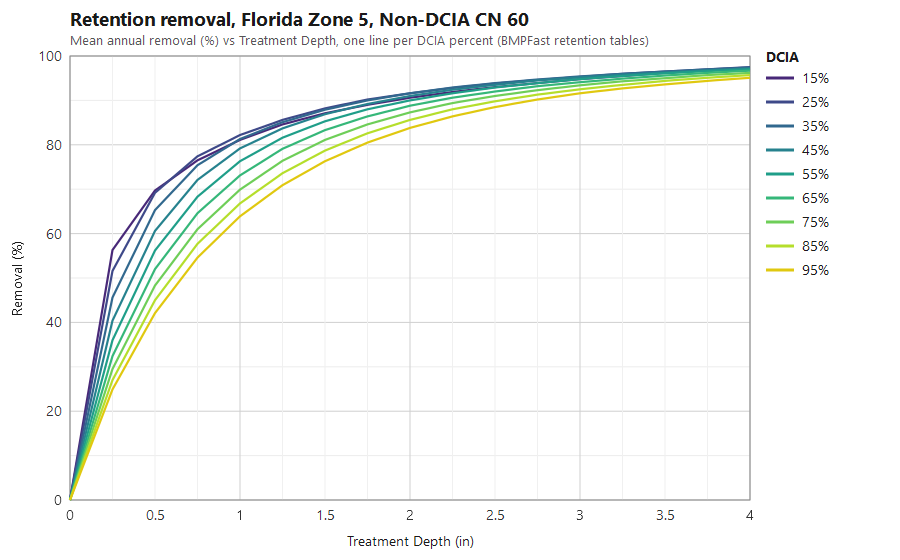
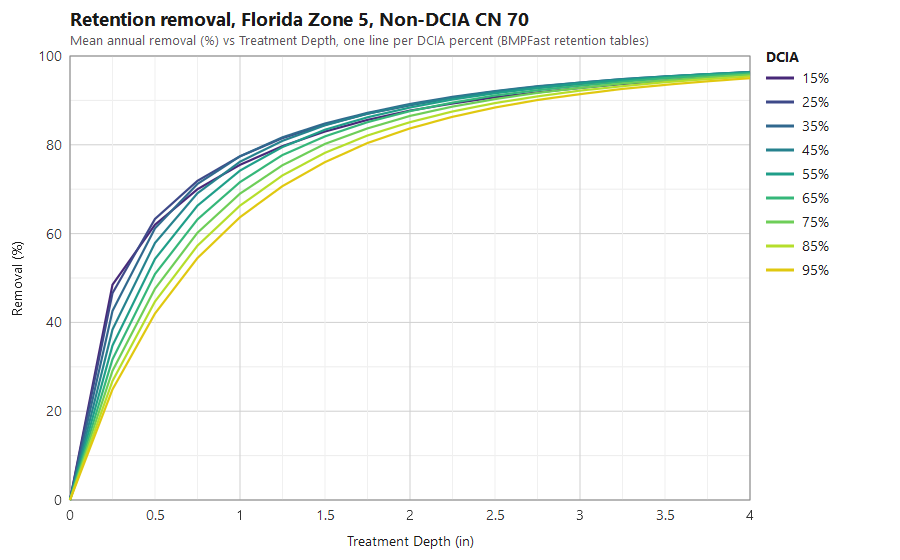
Each plot shows mean annual removal against Treatment Depth (0 to 4 in) for one zone and one Non-DCIA Curve Number, with one line for each DCIA percent from 15 % to 95 % in steps of 10 %. BMPFast calculated the values itself, through the function above. To read a value, find the Treatment Depth on the bottom axis, go up to the line for the site’s DCIA percent, and read the removal on the left axis. For a curve number between 50, 60 and 70, the value lies between the plots.
Two things stand out. Most of the removal comes from the first inch or so of retention, and each further inch adds less. And the curve number matters most where the DCIA is low: when most of the catchment is pervious, the runoff from that pervious area decides how much of it a given depth can capture. In Zone 1 at 1 in, for example, DCIA 15 % gives 89 % removal at CN 50 but 78 % at CN 70, while DCIA 95 % gives 62 % and 61 %.
Why the 15 % line crosses the others. At a low DCIA, removal does not always fall as the DCIA rises: it first rises, up to about 20 to 30 % DCIA, and only then falls. So in some plots the 15 % line runs below the 25 % line, most visibly in Zones 3 and 5. This is in the published tables themselves, not an error in BMPFast. In Harper and Baker (2007), Appendix D, Zone 3 at 0.50 in and CN 70 gives 64.2 % at 15 % DCIA and 66.2 % at 25 %; Zone 5 at 0.50 in and CN 70 gives 62.0 % and 63.3 %. Every value in BMPFast’s tables was compared with the report and they agree.
Zone 1
Zone 2
Zone 3
Zone 4
Zone 5
Source
The tables are the mean annual mass removal efficiencies for retention in Florida’s five meteorological zones, as used in the BMPTrains model: Harper, H.H. and Baker, D.M. (2007), Evaluation of Current Stormwater Design Criteria within the State of Florida, final report, FDEP Contract S0108 (Link), Appendix D, “Calculated Performance Efficiency of Dry Retention as a Function of DCIA and Non-DCIA Curve Number”: one table for each zone and each depth from 0.25 to 4.00 in. BMPFast’s tables match the report’s value for value. The report explains how the tables were made (Section 5.2.1.1, “Evaluation Methodology”): the runoff from a hypothetical 1-acre site was simulated continuously with the historical rainfall record of the meteorological stations in each zone, for 315 combinations of DCIA (0 to 100 % in steps of 5) and Non-DCIA CN (30 to 95 in steps of 5, and 98). Each event’s runoff was routed into a theoretical dry retention pond that recovers 50 % of its volume in 24 hours and 100 % in 72 hours, and the share of the annual runoff the pond retained is the removal in the tables. The same tables are adopted for dry retention in the Environmental Resource Permit Applicant’s Handbook Volume I (June 28, 2024), Appendix O. The BMPTrains model is described in the BMP Trains 2020 User Manual, Stormwater Management Academy, University of Central Florida (Link).
Sample problems
Worked problems solved in BMPFast, each with every input, the steps with screen captures, the program’s results, a hand check and the project file to download. Captures are for demonstration only. All of them: BMPFast sample problems.
- Retention basin for a 10-acre subdivision
- Retention for a specified removal of 75 %
- Exfiltration trench under a parking lot
- Exfiltration for a subdivision discharging to an OFW
- Permeable concrete parking with a stone reservoir
- Permeable pavement in a redevelopment
- Swale with groundwater discharge (sample project)
- Roadside swale with swale blocks
- BMPs in series: retention basin then wet pond
- BMPs in series: two retention basins
- BMPs in series: wet pond with stormwater harvesting
- BMPs in series: permeable pavement then wet pond
- BMPs in series: tree well, exfiltration and retention
- Sizing a retention basin
- Retention efficiency from the tables: Zone 2, 1.2 in
- Retention efficiency between two tables: Zone 4, 0.8 in