
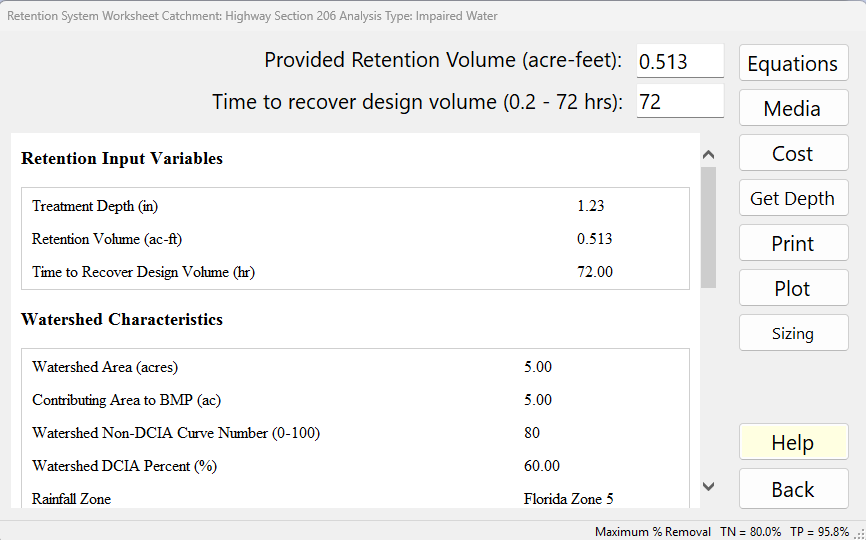
The Retention System Worksheet is where you enter a retention basin for the current catchment and see how much of the average annual runoff, nitrogen and phosphorus it removes. Open it from Treatment Options with the Retention Basin button. You enter the volume the basin provides (and, if you know it, how fast that volume is recovered); BMPFast takes the catchment’s area, curve number, DCIA and rainfall zone from the catchment you entered earlier.
Description
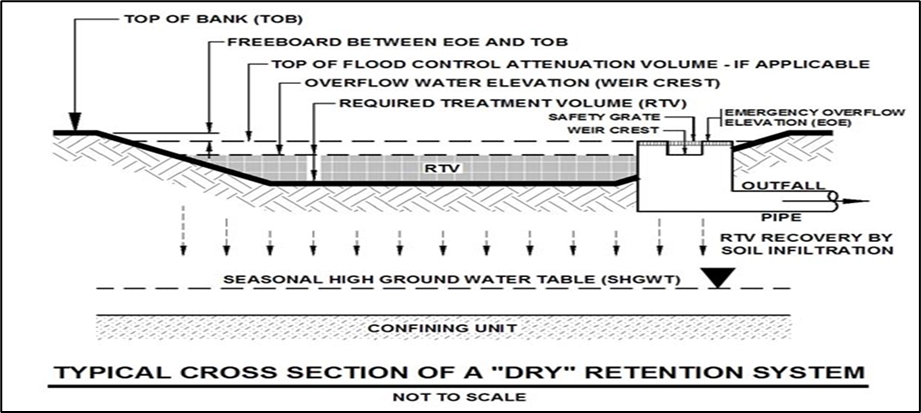
A “retention basin” is an area that is designed to store and retain a defined volume of runoff, allowing it to infiltrate and percolate through permeable soils or media into the groundwater. They are constructed or natural depression areas, often integrated into a site’s landscaping, where their bottom is typically flat, and turf, natural ground covers, or other appropriate vegetative or other methods are used to promote infiltration and stabilize the basin bottom and slopes.
Retention basins provide numerous benefits, such as reducing stormwater runoff volume, which reduces the average annual pollutant loading that may be discharged from the land. Additionally, many stormwater pollutants such as suspended solids, oxygen demanding materials, heavy metals, bacteria, some varieties of pesticides, and nutrients are removed as runoff percolates through the soil profile.
The capture percentage on an annual basis is dependent on the rainfall zone, the characteristics (DCIA and CN) of the catchment, and the size of the basin. The annual treatment effectiveness of all retention BMPs is directly related to the percentage of the average annual stormwater volume that is captured and not surface discharged.
Effectiveness was estimated for the volume of storage using simulations of runoff over at least 25 years. The capture design depth (inches) is calculated as the required treatment volume (RTV) of the basin divided by the watershed area with conversion factors (see Harper and Baker, 2007, and Wanielista and Yousef, 1993).
For most catchments, the maximum retention depth is no more than 4 inches because the annual capture is usually above 97% and the highest removal standard is 95%. The retention efficiency tables in BMPFast stop at 4 inches; a larger depth is given the 4-inch value.
Applicant’s Handbook reference
Appendix O, Table 1 (BMP Efficiencies), Retention Pond and Retention Systems: removal is “based on percent reduction using project’s percent directly connected impervious area (DCIA), non-DCIA curve number (CN), and rainfall zone”; BMPFast reads it the same way.
Appendix O, Dry Retention Systems: the design volume is expressed as inches over the catchment area, and the tables run from 0.25 to 4.00 inches for each of the five zones; BMPFast uses these tables and gives a depth above 4 inches the 4-inch value.
Source reference
Harper, H.H. and Baker, D.M. (2007). Evaluation of Current Stormwater Design Criteria within the State of Florida. Final report, FDEP Contract S0108, Appendix D (Calculated Performance Efficiency of Dry Retention as a Function of DCIA and Non-DCIA Curve Number) and Section 5.2.1.1 (Evaluation Methodology) (link): the retention tables come from a continuous simulation of each zone’s rainfall record, with a dry pond that recovers 50 % of its volume in 24 hours and all of it in 72 hours; BMPFast’s tables, 0.25 to 4.00 in for Zones 1 to 5, match the report value for value.
Wanielista, M.P. and Yousef, Y.A. (1993). Stormwater Management. John Wiley & Sons, New York: cited here for expressing the treatment volume as a depth over the watershed; BMPFast divides the volume by the contributing area, the catchment less any wet pond area.
Inputs
| Input | Units | What it means / how it is used |
|---|---|---|
| Provided Retention Volume (acre-feet): | ac-ft | The treatment volume the basin holds and recovers by infiltration (the provided treatment volume). BMPFast converts it to a Treatment Depth over the contributing area (see below) and reads the annual capture for that depth from the retention efficiency tables. Double-clicking the box recalculates and shows the report. A value greater than 0 marks the retention BMP as defined for this catchment. |
| Time to recover design volume (0.2 – 72 hrs): | hours | How long the basin takes to recover (empty) the design volume. A value from 0.2 to 36 hours raises the efficiency by the Recovery-Time Adjustment described below; the faster the recovery, the larger the increase. A value above 36 hours makes no change. Values below 0.2 are taken as 0.2 and above 72 as 72. A blank box or 0 is taken as 72 hours (no adjustment). The box’s tooltip gives the same rule. |
All other values the calculation needs come from the catchment: the post-development area, the wet pond area (no loading from that area), the non-DCIA curve number, the DCIA percent, the rainfall zone and rainfall, and the N and P concentrations (EMCs). Change them in the Catchment Characteristics screen.
Treatment Depth (TD) Calculation
Methodology. BMPFast treats this BMP as retention. Retention BMPs compares how every retention BMP calculates its Treatment Depth, and Retention Methodology explains the retention curves it is read on.
The retention treatment depth (TD) is calculated as the provided treatment volume (PTV) divided by the contributing area (CA), multiplied by 12 inches per foot:
TD (inches) = PTV (acre-feet) × 12 inches/ft ÷ CA (acres)
- TD = treatment depth (inches over the contributing area)
- PTV = provided treatment volume (acre-feet)
- CA = contributing area (acres) = post-development catchment area − wet pond area. With no wet pond, CA is the whole post-development catchment area.
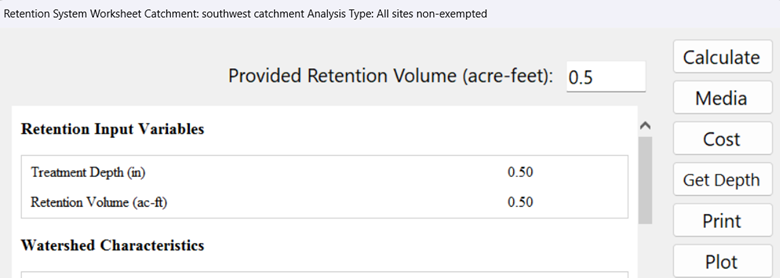
For this example, the provided retention volume is 0.5 acre-feet and the contributing area is 12 acres. Thus:
0.5 ac-ft × 12 inches/ft ÷ 12 acres = 0.5 inches
For this example, the removal effectiveness is 63%.
From treatment depth to removal
- The hydraulic capture efficiency (percent of the average annual runoff retained) is read from the retention efficiency lookup tables for the Treatment Depth, the watershed’s non-DCIA curve number, DCIA percent and rainfall zone. The tables are at 0.25-inch steps from 0 to 4 inches and BMPFast interpolates between them. A DCIA below 5% is looked up as 5%.
- N and P removal are equal to the hydraulic capture efficiency.
- The Recovery-Time Adjustment (below) is added to the capture efficiency and to N and P removal. N and P removal cannot exceed 100%.
Applicant’s Handbook reference
Appendix O, Dry Retention Systems, Mean Annual Mass Removal Efficiencies tables: the tables give the mean annual mass removal by percent DCIA and non-DCIA CN, with linear interpolation between increments of 5; BMPFast interpolates the same way, uses the removal for both N and P, and reads a DCIA below 5 % (the first column) as 5 %.
Recovery-Time Adjustment
The efficiency from the retention lookup tables is raised by an adjustment that depends on the Treatment Depth and on how quickly the design volume is recovered. With x = Treatment Depth (in) and T = Time to Recover Design Volume (hr):
T <= 3 hr:       Adjustment (%) = -0.1365 x^4 + 1.5228 x^3 - 5.0475 x^2 + 2.3674 x + 8.8133
3 < T <= 36 hr:  Adjustment (%) = 0.0083 x^4 - 0.1518 x^3 + 1.0071 x^2 - 3.0705 x + 3.7676
Hydraulic Capture (%) = Lookup Table Capture (%) + Adjustment
N removal (%) = P removal (%) = Lookup Table Capture (%) + Adjustment- No adjustment is made when T is not entered (0) or is greater than 36 hours. On this worksheet a blank or 0 is stored as 72 hours, so it also gets no adjustment.
- A negative adjustment is set to 0.
- N and P removal cannot exceed 100%.
For example, at a Treatment Depth of 1.0 inch the adjustment is about 7.5% for a recovery time of 3 hours or less, and about 1.6% for a recovery time between 3 and 36 hours. The adjustment gets smaller as the depth increases (at 3 inches it is about 0.6% and 0.2%).
Applicant’s Handbook reference
Appendix O, Dry Retention Systems: the treatment volume must be recovered “within 72 hours or less, equivalent to the volume recovery period utilized for generation of the performance efficiency summarized in the tables”; BMPFast differs: for a recovery time of 36 hours or less it adds a Recovery-Time Adjustment that is not in the handbook.
Source reference
BMPFast method (Storage.CalculateRecoveryDesignTimeAdjustment, Storage.cs; on the Equations page since 2026-10-02): the two polynomials for a recovery time of 3 hours or less and of 3 to 36 hours are BMPFast’s; the program does not give the study they were fitted to, and the retention tables themselves assume a 72-hour recovery.
Results (the report)
After you click Calculate, the report pane shows:
- Retention Input Variables: Treatment Depth (in), Retention Volume (ac-ft) and Time to Recover Design Volume (hr).
- Watershed Characteristics: Watershed Area (acres), Contributing Area to BMP (ac), Watershed Non-DCIA Curve Number, Watershed DCIA Percent (%), Rainfall Zone and Rainfall (in), all from the catchment.
- Surface Water Discharge: Provided Nitrogen Treatment Efficiency (%) and Provided Phosphorus Treatment Efficiency (%). The report shows at most 99%.
- Media Mix Information (only when a media mix is selected with the Media button): Type of Media Mix, Media N Reduction (%) and Media P Reduction (%).
- Groundwater Discharge (Stand-Alone) (when the project does groundwater analysis or a media mix is selected): the Average Annual Recharge (MG/yr infiltrated), TN Mass Load (kg/yr), TN Concentration (mg/L), TP Mass Load (kg/yr) and TP Concentration (mg/L) in the water reaching the groundwater, after any media reduction.
- Surface Discharge Load Diagram (stand-alone: runoff from this catchment only, no routing): Load in (N, P in kg/yr; Q in ac-ft/yr) → Treatment (N, P %) → Surface Discharge (N, P, Q leaving the basin), with the Mass Reduction (N, P kg/yr) retained by the basin.
Buttons
| Button | What it does |
|---|---|
| Calculate / Equations / Report | When you have changed an input, the button reads Calculate: a click reads the boxes, calculates and shows the report. Once the report is current, the button reads Equations: a click shows the Equations page (below) in the same pane, and the button then reads Report to switch back. |
| Media | Opens the Media Mix form to choose pollution control media for the water that infiltrates to the groundwater. It changes the groundwater results, not the surface discharge removal. |
| Cost | Opens the Cost Analysis for this retention basin. |
| Get Depth | Asks for a target average annual efficiency (%) and finds the treatment depth that gives it from the retention lookup tables, then shows the depth (in), the contributing area (ac) and the retention volume (ac-ft) needed, and asks “Do you want to set the retention to these values?”. Yes replaces the volume on the form. A target of 0 or less, or above 98%, does nothing. The depth search stops at 4 inches. The recovery time is not considered in this calculation (the button’s tooltip says so): the target is met without the Recovery-Time Adjustment, so with a short recovery time the calculated efficiency will be a little higher than the target. |
| Opens the report in the Report Viewer to print or save it. | |
| Plot | Opens the Retention Treatment Efficiency chart: efficiency (%) against retention depth from 0 to 4 inches for this catchment’s curve number, DCIA and rainfall zone, with a marker at the current treatment depth and efficiency. The marker is the hydraulic capture efficiency, which includes any Recovery-Time Adjustment; the curve is the lookup table alone, so with a short recovery time the marker sits above the curve. The chart says so in the marker’s label. |
| Sizing | Opens the Sizing window for this basin (see below). |
| Help | Opens this page. |
| Back | Reads the boxes, calculates, saves the values to the project and closes the worksheet. |
The bar along the bottom of the window shows the project’s Maximum % Removal for TN and TP: the removal your analysis type requires. Compare the Provided efficiencies in the report against it.
The Equations page
Click Equations (after Calculate) to see how the result was obtained, with the current numbers. It has these sections:
- Equations: Treatment Depth (in) = Retention Volume (ac-ft) / Contributing Area (ac) x 12.
- Notes: capture is read from the retention efficiency lookup tables for the Treatment Depth, and depends on the non-DCIA curve number, DCIA percent and rainfall zone; N and P removal are equal to the hydraulic capture efficiency; the recovery-time adjustment is added to the capture and to N and P removal.
- Values: Retention Volume, Contributing Area, Watershed Area, Non-DCIA Curve Number, DCIA Percent, Rainfall Zone, Treatment Depth, Hydraulic Capture, Treatment Rate (the media’s rate in gpm/sf, or “no media mix”), N removal and P removal.
- Recovery-Time Adjustment: the two adjustment equations and their rules (as above), and a table of the values used: Time to Recover Design Volume (T), Treatment Depth (x), the curve used (“T <= 3 hr curve”, “3 < T <= 36 hr curve”, “T > 36 hr: no adjustment” or “T not entered: no adjustment”) and the Recovery Time Adjustment (%).
Sizing
How the Sizing window works, for every BMP, is on Sizing.
The Sizing button opens a window for finding the retention volume that meets your N and P removal targets. For a retention basin the one sizing variable is Retention Volume (ac-ft; arrow step 0.1, minimum 0.01). The window plots N and P removal against the volume, with the target lines (they start at the project’s Maximum % Removal and can be changed; Default targets puts them back), a line at the current volume and a marker where both targets are met. Use the ▲/▼ arrows or type a value; Use sets the volume to the value where both targets are met. The line under the values shows the resulting treatment depth (the tables stop at 4 inches). Equations opens the Equations page, Print prints the chart and Copy copies it to the clipboard. Apply keeps the new volume; Cancel (or closing the window) puts back the volume you had.
Discovery Plot Example
To illustrate how the discovery aspects of the software are used, assume the performance standard specifies an 80% removal of phosphorus. The Plot button is used to generate a discovery plot showing the change in effectiveness as a function of retention depth.
For this example (same catchment and no additional inputs between the two retention BMPs), the additional treatment depth required to achieve 80% removal is another 0.5 inches (1.0 inch − 0.5 inch).
Note that the addition of two separate effectiveness values (e.g., 63% and 63%) must not exceed 100%. The same pollutants cannot be removed twice, so the fundamental relationship shown below must be maintained.
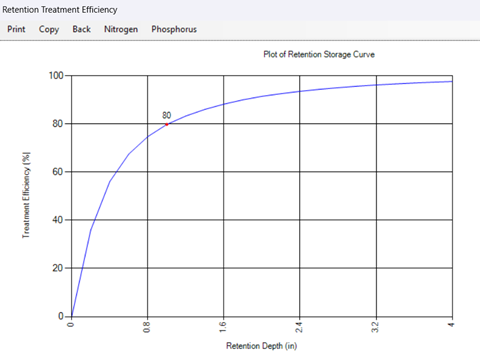
Discovery plot illustrating effectiveness as a function of retention volume (vertical reference line must be retained).
The Plot curve is the lookup-table efficiency only. When a Recovery-Time Adjustment applies, the marker for the current design sits above the curve by the amount of the adjustment.
Combined Removal Using Two Retention Basins
The calculation for overall removal (retention basin 1 + retention basin 2) cannot use the series equation of the Applicant’s Handbook, Volume 1 (June 28, 2024), page 9.7.
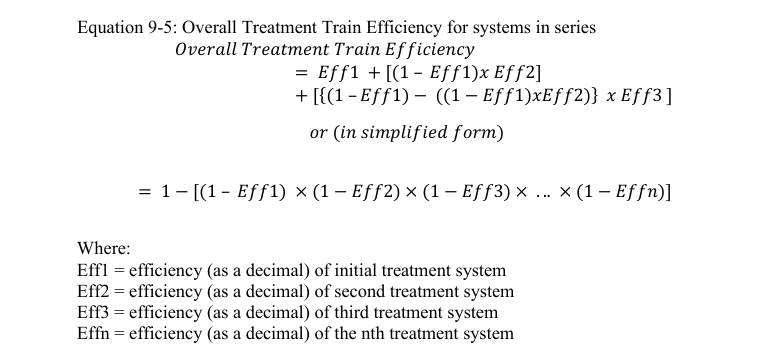
For example, for two basins in series where both are calculated at 63% removal, applying a series equation would produce:
1 − [(1 − 0.63) × (1 − 0.63)]
= 1 − (0.37 × 0.37)
= 1 − 0.137
= 0.863 or 86.3% (incorrect)
It is also certainly not the sum of both removals (63% + 63% = 126%), which is not physically possible.
BMPFast handles this in BMPs in Series: when the upstream BMPs are all retention BMPs, their treatment depths are added and the efficiency is read from the retention tables for the combined depth (reported as the Equivalent Treatment Depth and Equivalent Treatment Efficiency).
Applicant’s Handbook reference
Section 9.5.1 Treatment Train Nutrient Reduction (Equation 9-5): the series equation assumes each BMP acts independently, and where a downstream BMP’s efficiency is reduced by an upstream one “the designer should consider the use of another methodology”; BMPFast does this for retention in series by adding the treatment depths and reading the tables once.
Source reference
BMPFast method (MultipleBMP.CalculateEquivalentRetentionDepth; retention-led series of every kind, Ron, 2026-10-01): retention BMPs at the head of a series, or retention BMPs in a routed strand, are one system: their Treatment Depths are added and the removal is read once from the retention tables.
FDEP and the water management districts (2010). Stormwater Quality Applicant’s Handbook: Design Requirements for Stormwater Treatment Systems in Florida, March 2010 draft (not adopted), Section 22.3 Dry Retention In Series, Table 22.3-2, notes 2 and 3 (the draft, not adopted: PDF, 16 MB): in its worked example the downstream basin’s efficiency is read from the dry retention tables at the sum of the two basins’ retention depths (2 in = 1.00 + 1.00 in; 1.89 in = 1.00 + 0.89 in), and the downstream basin is credited with the difference from the upstream basin’s efficiency; BMPFast’s Equivalent Treatment Depth adds the depths in the same way.
Notes and messages
- If the catchment has no rainfall zone, no efficiency is calculated. Set the zone in General Site Information.
- Get Depth: “Contributing area is zero or undefined. Cannot compute required retention volume.” The catchment’s post-development area minus its wet pond area is 0. Correct the catchment areas.
- Get Depth: “An error occurred calculating required depth: …” The value typed was not a number, or the calculation failed. Type a number such as 80.
In BMPFast 2
Recovery-time credit. In BMPFast 2 the Recovery-Time Adjustment is a choice on the Entry tab, Recovery-time credit: None (Appendix O tables only), the default, or Add BMPFast’s credit (36 hours or less) (Ron Eaglin, October 19, 2026). It is BMPFast’s own credit beyond the Applicant’s Handbook, Appendix O, which ties the retention tables to recovery within 72 hours and gives no credit for faster recovery; no published source has been found for its curves (Retention Methodology), so the permitting agency may not accept it. With None, the removal matches the Appendix O tables exactly. BMPFast (v1) always adds it when the time to recover is 36 hours or less.
Values outside the tables. BMPFast 2 still calculates, but shows a red warning, OUTSIDE THE LIMITS OF THE METHODOLOGY, when the Treatment Depth is above 4.00 in or below 0.25 in, or the catchment’s non-DCIA curve number is outside 30 to 98, or its DCIA is below 5 % (how BMPFast reads beyond the tables).
Comparison of methods
Where a retention basin is combined with other BMPs, in one catchment or in a routing, BMPFast can calculate it more than one way. Each page below works one problem by each method and shows how far apart they are; each says which method BMPFast uses. Every number on them is from BMPFast.
- Comparison of Methods for Calculating Retention BMPs in Series — two or more retention BMPs one after the other in one catchment (BMPs in Series): their Treatment Depths added (one storage) or Equation 9-5, over a range of sizes.
- Comparison of Methods for Calculating Retention Followed by Wet Detention — a retention basin followed by a wet detention pond: BMPFast’s method, the routing and Equation 9-5, over a range of basin sizes.
- Comparison of Methods for Calculating Retention Followed by a Surface Discharge Filter — a retention basin followed by a filter: Equation 9-5 (what BMPFast uses) or the two as one storage, over a range of filter sizes.
- Strand Based Routing for Retention in Series — retention catchments routed one into another: Treatment Depth Allocation (BMPFast 2’s default), Equation 9-5 or the Treatment Depths added, over a range.
Sample problems
Worked problems solved in BMPFast, each with every input, the steps with screen captures, the program’s results, a hand check and the project file to download. Captures are for demonstration only. All of them: BMPFast sample problems.