
A strand is a run of catchments routed one into the next, in which no catchment receives water from more than one catchment. When every catchment in the strand has a retention-type BMP (Retention, Exfiltration, Swale, Tree Well, Rain Garden or a buffer set to Retention, Permeable Pavement), BMPFast calculates the strand as one Retention in Series system instead of catchment by catchment. The Routing screen and the Complete Report name the method for each strand. See Routing.
This page shows the calculation BMPFast uses, the other methods that have been used or proposed, and how far apart they are on a worked example.
BMPFast 2: Treatment Depth Allocation
Decided (Ron Eaglin, October 19, 2026): BMPFast 2 calculates a Retention in Series strand by Treatment Depth Allocation. It is the method of Marty Wanielista’s spreadsheet Retention Multiple Catchment Effectiveness (Retention in Series with allocated retention volumes per catchment). A basin counts in proportion to the area it serves, so a small basin on a small catchment no longer adds as much as a large basin on a large one. BMPFast 2 also offers the other method Ron named, efficiencies in series (the Applicant’s Handbook Vol. I, Section 9.5.1, Equation 9-5), and v1’s Treatment Depths added for comparison: choose under Retention basins in series on the Catchment Routing’s Entry tab. BMPFast (v1) keeps Treatment Depths added, below.
At each catchment, going down the strand:
Basin volume (ac-ft) = Treatment Depth (in) × catchment area (ac) / 12
Treatment Depth so far (in) = (sum of the basin volumes so far, ac-ft) × 12 / (sum of the catchment areas so far, ac)
Each basin's share (TD allocation) = Treatment Depth so far × its volume / the volume so far
Removal at this catchment (%) = retention curves (Treatment Depth so far, this catchment's Non-DCIA CN and DCIA %, zone)
Load removed here (kg/yr) = this catchment's own load × removal / 100   (N and P alike)
Strand removal (%) = sum of the loads removed / sum of the catchments' loads × 100
The removal at a catchment is applied to that catchment’s own load only, the water from its parent catchment; what comes from upstream has already been counted where it entered. Load from above the strand (from a junction) is removed at the first catchment, where it enters. Each BMP’s own adjustments (recovery time, credits) are not applied.
Worked example by hand
Three catchments routed 1 → 2 → 3 → outlet, each with a retention basin, in Florida Zone 4 (the 2020 TAC manual, pages 190–196; the sample project Retention Multiple catchments 2020 Manual pages 190 196.bmpt).
| Catchment | Area (ac) | Non-DCIA CN | DCIA (%) | Basin volume (ac-ft) | TN load (kg/yr) | TP load (kg/yr) |
|---|---|---|---|---|---|---|
| 1 | 20.75 | 76.12 | 17.90 | 0.865 | 46.73 | 11.66 |
| 2 | 25.13 | 76.12 | 17.80 | 1.466 | 53.29 | 12.65 |
| 3 | 37.41 | 84.00 | 19.00 | 2.245 | 107.12 | 26.72 |
Step 1, the Treatment Depth so far.
Catchment 1: 0.865 × 12 / 20.75 = 0.500 in
Catchment 2: (0.865 + 1.466) × 12 / (20.75 + 25.13) = 2.331 × 12 / 45.88 = 0.610 in
Catchment 3: (0.865 + 1.466 + 2.245) × 12 / (20.75 + 25.13 + 37.41) = 4.576 × 12 / 83.29 = 0.659 in
Step 2, the TD allocation (each basin’s share of the volume so far; it shows where the depth comes from, and the shares add up to the Treatment Depth so far).
| Catchment | Treatment Depth so far (in) | Basin 1 | Basin 2 | Basin 3 |
|---|---|---|---|---|
| 1 | 0.500 | 0.500 (100 %) | ||
| 2 | 0.610 | 0.226 (37.1 %) | 0.383 (62.9 %) | |
| 3 | 0.659 | 0.125 (18.9 %) | 0.211 (32.0 %) | 0.323 (49.1 %) |
Step 3, the removal at each catchment, from the retention curves (Zone 4) with that catchment’s own Non-DCIA CN and DCIA, and the load removed from its own runoff.
| Catchment | Treatment Depth so far (in) | Removal (%) | TN load | TN removed | TP load | TP removed |
|---|---|---|---|---|---|---|
| 1 | 0.500 | 65.4 | 46.73 | 46.73 × 0.654 = 30.55 | 11.66 | 7.62 |
| 2 | 0.610 | 69.2 | 53.29 | 53.29 × 0.692 = 36.88 | 12.65 | 8.75 |
| 3 | 0.659 | 64.8 | 107.12 | 107.12 × 0.648 = 69.41 | 26.72 | 17.31 |
| Strand | 207.14 | 136.84 | 51.03 | 33.69 |
TN removal = 136.84 / 207.14 = 66.1 %;  TP removal = 33.69 / 51.03 = 66.0 %
TN at the outlet = 207.14 − 136.84 = 70.30 kg/yr;  TP = 51.03 − 33.69 = 17.34 kg/yr
Catchment 3’s removal (64.8 %) is lower than catchment 2’s although its depth is larger, because catchment 3 has more impervious area (CN 84, DCIA 19 %): the curves are read with each catchment’s own CN and DCIA.
The same example by the other methods (BMPFast 2 gives these on the same project):
| Method | TN removed (kg/yr) | TN removal |
|---|---|---|
| Treatment Depth Allocation (BMPFast 2’s default) | 136.84 | 66.1 % |
| Efficiencies in series (Equation 9-5): each basin at its own Treatment Depth (0.50, 0.70, 0.72 in), removing its share of all that reaches it, the loads chained | 165.81 | 80.0 % |
| Treatment Depths added (BMPFast v1): 0.50 + 0.70 + 0.72 = 1.92 in, the curves at the sum on all the load | 185.64 | 89.6 % |
| Equation 9-5 on the three removals alone, 1 − (1 − 0.654)(1 − 0.692)(1 − 0.648), as if all the load passed all three basins | 96.2 % |
The Report tab of the routing (Flow Balance) shows the Treatment Depth so far, the TD allocation and the removal of each catchment, as in the tables above.
The method BMPFast (v1) uses: Treatment Depths added
BMPFast calculates a Retention in Series strand as one system and adds the Treatment Depths of its BMPs. Each BMP’s Treatment Depth is its own (its storage over its own area, Retention BMPs). Their sum, the Equivalent Treatment Depth, is read once on the retention curves, and that capture is the removal of all the nitrogen and phosphorus that enters the strand. This is the same rule BMPs in Series uses for retention BMPs in one catchment (Ron, October 15, 2026).
Equivalent Treatment Depth (in) = sum of the Treatment Depths of the BMPs in the strand
Capture (%) = retention curves (Equivalent Treatment Depth, area-weighted Non-DCIA CN and DCIA % of the strand's catchments, zone)
N removal (%) = P removal (%) = Capture
Load at the end of the strand = all the load entering the strand × (1 − Capture / 100)
The strand report (“Retention In Series – Equivalent Treatment Depth & Effectiveness” in the Complete Report) lists, for each catchment, its BMP’s Treatment Depth and the Equivalent Treatment Depth from the top of the strand down to it, with the capture there and the load removed. The last row is the whole strand, and its System Summary gives the load discharged, which is the outlet load. The report, the outlet and the strand’s treatment efficiency use the same numbers. Adjustments a BMP makes on its own worksheet (the Recovery-Time Adjustment, the Rain Garden’s credit) are not applied to the system, as in BMPs in Series.
Applicant’s Handbook reference
Appendix O, Dry Retention Systems: removal is read from the mean annual mass removal tables at the retention depth in inches over the catchment area; the handbook does not describe adding the treatment depths of retention BMPs in series. Adding them is BMPFast’s method, as in BMPs in Series.
Section 9.5.1 Treatment Train Nutrient Reduction (Equation 9-5): Equation 9-5 assumes each BMP acts independently (Method A below); where a downstream unit depends on an upstream one, “the designer should consider the use of another methodology”, which is the basis for treating the strand as one system.
Worked example
Catchment 2 (99 ac, no other BMP) routed to catchment 1 (1 ac), each with a retention basin holding 0.5 in over its own area (4.125 and 0.042 ac-ft), in Florida Zone 2 with Non-DCIA CN 70 and DCIA 24.33 %. The catchments produce 100.0 kg/yr of nitrogen.
| Catchment | Area (ac) | Treatment Depth (in) | Equivalent Treatment Depth (in) | Capture (%) | N entered so far (kg/yr) | N leaving (kg/yr) |
|---|---|---|---|---|---|---|
| 2 | 99 | 0.50 | 0.50 | 75.3 | 99.01 | 24.45 |
| 1 | 1 | 0.50 | 1.00 | 88.0 | 100.01 | 12.00 |
At the outlet: 12.00 kg/yr of nitrogen, 88.0 % removed.
Other methods
A. Each BMP’s own capture, chained (the outlet until October 15, 2026)
Each BMP keeps its own Treatment Depth and capture, and removes its share of all the load reaching it; the loads are chained down the strand. It counts the second basin again on the water that has already overflowed the first, in the larger storms when the second basin is filling too, so it gives the most removal.
Load leaving catchment i = (load leaving the catchment above + load of catchment i) × (1 − its own capture / 100)B. System depth on each catchment’s own load (the strand report until October 15, 2026)
At each catchment, all the volume from the top of the strand down to it over all their area, with that capture applied to the catchment’s own load only. The report showed this while the outlet used A, so the two disagreed.
System Treatment Depth at i (in) = 12 × (sum of Retention Volumes, top of strand to i) / (sum of their areas)
Removed at i = load of catchment i × capture at that depth / 100
C. Spread the downstream storage over all the area draining to it
What BMPFast does for a retention BMP at a junction and for untreated catchments flowing into one: the downstream BMP’s volume is spread over all the area that drains to it.
Treatment Depth of BMP i (in) = 12 × its Retention Volume / all the area draining to itE. One system, all the volume over all the area
System Treatment Depth (in) = 12 × sum of Retention Volumes / sum of areas
Removed = all the load × capture at that depth / 100
The differences
| Method | Depths used (in) | N removal (%) | N at the outlet (kg/yr) |
|---|---|---|---|
| Used: one system, Treatment Depths added | 0.50 + 0.50 = 1.00 | 88.0 | 12.00 |
| A. Each BMP’s own capture, chained | 0.50, then 0.50 | 93.7 | 6.28 |
| B. System depth on each catchment’s own load | 0.50, 0.50 | 75.3 | 24.70 |
| C. Downstream storage spread over the area draining to it | 0.50, then 0.005 | 74.8 | 25.16 |
| E. One system, all the volume over all the area | 0.50 | 75.3 | 24.70 |
Adding the depths (the method used) and taking all the volume over all the area (E) both treat the strand as one storage; they differ in that the sum adds depths measured over different areas, as BMPs in Series does. Chaining each basin’s own capture (A) gives the most removal. Spreading the small downstream basin over all 100 ac (C) gives it almost nothing to add.
The methods over a range of basin sizes
The worked example above has one size of each basin. Here the upstream basin stays at 0.5 in and the downstream basin goes from 0.05 to 3.5 in over its own catchment, in the example’s layout (99 ac routed to 1 ac) and with the area split equally (50 ac to 50 ac). The method BMPFast uses (Treatment Depths added) and C (node by node, the program’s other routing algorithm, ComplexRouting.Calculate) were calculated by the program. A, B and E are put together from the program’s retention curves for these catchments.
99 ac routed to 1 ac (the worked example)
| Downstream basin (in) | Its volume (ac-ft) | BMPFast (%) | A. Chained (%) | B. Old report (%) | C. Node by node (%) | E. All volume over all area (%) |
|---|---|---|---|---|---|---|
| 0.05 | 0.004 | 76.9 | 77.5 | 75.3 | 74.6 | 75.0 |
| 0.1 | 0.008 | 78.5 | 80.4 | 75.3 | 74.6 | 75.0 |
| 0.25 | 0.021 | 83.2 | 89.1 | 75.3 | 74.7 | 75.1 |
| 0.5 | 0.042 | 88.0 | 93.7 | 75.3 | 74.8 | 75.3 |
| 0.75 | 0.062 | 91.0 | 95.7 | 75.3 | 75.0 | 75.4 |
| 1 | 0.083 | 93.1 | 96.9 | 75.3 | 75.1 | 75.5 |
| 1.5 | 0.125 | 95.7 | 98.2 | 75.3 | 75.4 | 75.6 |
| 2 | 0.167 | 97.1 | 98.9 | 75.3 | 75.7 | 75.8 |
| 2.5 | 0.208 | 98.0 | 99.3 | 75.3 | 76.0 | 75.9 |
| 3 | 0.250 | 98.6 | 99.5 | 75.3 | 76.3 | 76.1 |
| 3.5 | 0.292 | 99.0 | 99.6 | 75.3 | 76.6 | 76.3 |
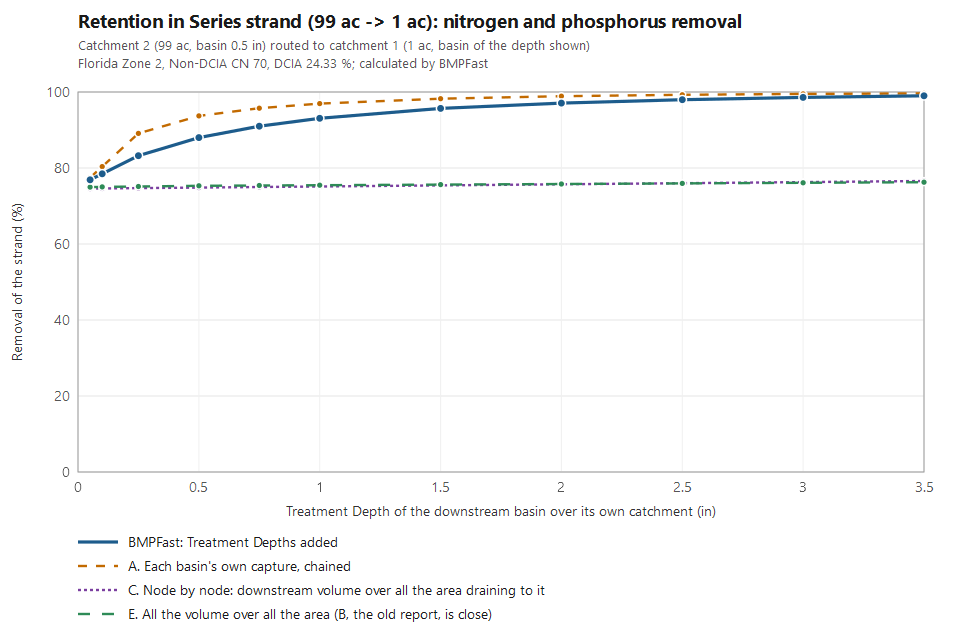
50 ac routed to 50 ac
| Downstream basin (in) | Its volume (ac-ft) | BMPFast (%) | A. Chained (%) | B. Old report (%) | C. Node by node (%) | E. All volume over all area (%) |
|---|---|---|---|---|---|---|
| 0.05 | 0.208 | 76.9 | 44.8 | 67.2 | 41.2 | 59.0 |
| 0.1 | 0.417 | 78.5 | 51.9 | 68.1 | 44.8 | 60.8 |
| 0.25 | 1.042 | 83.2 | 73.3 | 70.8 | 55.5 | 66.3 |
| 0.5 | 2.083 | 88.0 | 84.6 | 75.3 | 73.3 | 75.3 |
| 0.75 | 3.125 | 91.0 | 89.6 | 77.3 | 79.0 | 79.3 |
| 1 | 4.167 | 93.1 | 92.5 | 79.3 | 84.6 | 83.2 |
| 1.5 | 6.250 | 95.7 | 95.7 | 81.7 | 89.6 | 88.0 |
| 2 | 8.333 | 97.1 | 97.3 | 83.2 | 92.5 | 91.0 |
| 2.5 | 10.417 | 98.0 | 98.2 | 84.2 | 94.4 | 93.1 |
| 3 | 12.500 | 98.6 | 98.7 | 84.9 | 95.7 | 94.6 |
| 3.5 | 14.583 | 99.0 | 99.1 | 85.5 | 96.6 | 95.7 |
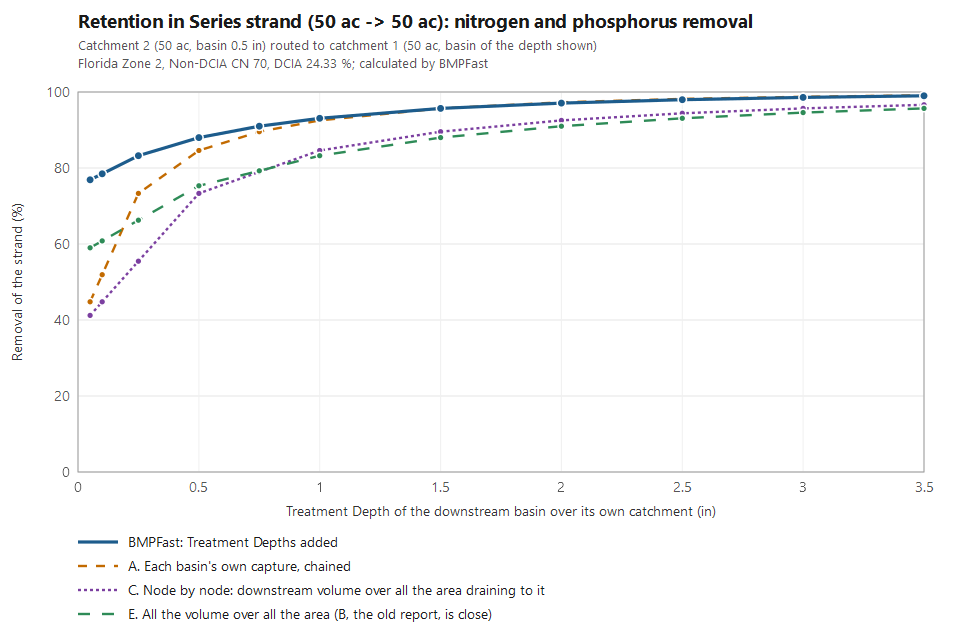
What the comparison shows
- BMPFast’s method depends only on the Treatment Depths, not on the areas: the two layouts give the same removal (93.1 % at 1 in), although the downstream basin holds 0.083 ac-ft in the first and 4.167 ac-ft in the second.
- When the downstream catchment is small (99 ac to 1 ac), a small basin there raises the strand’s removal a lot in BMPFast’s method (76.9 % to 99.0 %), while C and E, which spread its volume over all 100 ac, barely move (75.0 % to 76.3 % for E).
- When the areas are equal the methods are closer, but C and E stay below BMPFast’s method: at 1 in by 8.5 (C) and 9.8 (E) points, at 3.5 in by 2.4 and 3.3.
- Chaining each basin’s own capture (A) gives the most removal in every case, for the reason given on Comparison of Methods for Calculating Retention BMPs in Series.
Source reference
BMPFast’s method (Ron, October 15, 2026): adding the Treatment Depths of retention BMPs in series is the BMPTrains model’s rule for BMPs in Series (BMP Trains 2020 User Manual, Stormwater Management Academy, University of Central Florida, December 2021 (stars.library.ucf.edu/bmptrains/25)); Ron chose it for strands too, so a strand and a series in one catchment are calculated alike (plan 6.82).
Sample problems
Worked problems solved in BMPFast, each with every input, the steps with screen captures, the program’s results, a hand check and the project file to download. Captures are for demonstration only. All of them: BMPFast sample problems.
- BMPs in series: retention basin then wet pond
- BMPs in series: two retention basins
- BMPs in series: wet pond with stormwater harvesting
- BMPs in series: permeable pavement then wet pond
- BMPs in series: tree well, exfiltration and retention
- Routing: untreated catchment into a retention basin
- Routing: wet ponds in series (2020 manual)
- Routing: two subdivisions joining at a wet pond
Related pages
- Routing: how runoff moves between catchments, and what a strand is.
- Wet Detention Methodology: residence time and the pond equations.
- Retention Methodology and Retention BMPs: the retention curves and each BMP’s Treatment Depth.
- BMPs in Series: several BMPs in one catchment (Multiple BMP).
- Discovery Plots Methodology: plots that repeat the whole routing.
- Comparison of Methods for Calculating Retention BMPs in Series.
- Comparison of Methods for Calculating Retention Followed by Wet Detention.