
A Discovery Plot answers one question: if I change this one design value, what happens to the project’s result? Each point on the curve is a full calculation of the whole project at one value of the design value: every catchment, every BMP, the routing between catchments, and the project’s totals and targets. The result plotted is a system result, such as the nitrogen leaving the outlet or the treatment efficiency of the whole project, not the removal of one BMP on its own. This page explains how the points are calculated. How to use the window is on Discovery Plots.
Discovery Plots and a worksheet’s own plot
A BMP worksheet describes that BMP alone. Its removal is for the runoff of its own catchment, and its Plot button draws that BMP’s curve (for a retention basin, the retention curve for the catchment’s curve number, DCIA and zone). A Discovery Plot puts the same BMP back into the project. Its change is passed through the routing to every BMP downstream, mixed with the runoff of the other catchments, and measured at the outlet.
So the two can differ a great deal. A BMP that treats one catchment among several moves the system result only by its share of the load. A BMP upstream of others has part of its effect repeated or masked by the BMPs below it. And a change that looks large on the worksheet can be small at the outlet, or the reverse. The example below shows this with three wet ponds in series.
| BMP worksheet (Plot button, report) | Discovery Plot | |
|---|---|---|
| Runoff treated | That catchment’s own runoff | Everything routed to the BMP, as in the project |
| What is plotted | That BMP’s removal | A system result: outlet load, load removed, or treatment efficiency of the whole project |
| BMPs downstream | Not included | Recalculated at every point |
| Target | The BMP’s required removal | The project’s target (a horizontal line on the efficiency plots) |
How each point is calculated
- Set the value. The value you chose to vary (the X-Axis) is set to the next point of the range: Min, then Min + (Max – Min) / # Steps, and so on up to Max, so a plot has # Steps + 1 points.
- Hold it. The value is pinned for this calculation. Without that, the program would work it out again from the BMP’s dimensions (a retention basin’s Treatment Depth from its volume, a pond’s Average Residence Time from its pool and runoff), and the curve would be flat. Only this one value is pinned.
- Calculate the whole project. Every catchment and its BMP, then the routing between catchments, then the project’s totals and targets, exactly as when you run the analysis (see Routing). Values that depend on the varied one are recalculated: for example, a deeper retention basin upstream sends less water to a pond downstream, and that pond’s residence time changes with it.
- Read the result you chose for the Y-Axis, and go to the next point.
- Put the project back. When all points are done, every value in the project is restored as it was and the project is calculated once more in the normal way. Your inputs, results and reports are not changed by a Discovery Plot.
Source reference
BMPFast method (DesignCurveService.cs): holding the varied value, recalculating the whole project at each point and restoring the project afterwards is BMPFast’s method; only the target line comes from the handbook (Section 9.3).
A point whose calculation fails is left out of the curve rather than stopping it. A value outside the variable’s limits (for example a DCIA percent above 100) is plotted at the limit. When every point gives the same result, the window says the curve is flat: the value you varied does not affect that result.
What you can vary (X-Axis)
| Where | Values offered | Notes |
|---|---|---|
| Each catchment that is not disabled (Catchment Characteristics) | Pre and Post Non-DCIA Curve Number (30-100); Pre and Post DCIA Percent (0-100) | The Pre values change the pre-development load, and so the target when the analysis compares pre- and post-development. |
| A retention-type BMP (Retention, Exfiltration, Swale, Tree Well, Rain Garden and the buffers set to Retention, Permeable Pavement) | Treatment Depth (in) | Varied directly; the BMP’s dimensions are not changed. See Retention BMPs. |
| Wet Detention | Permanent Pool Volume (ac-ft); Average Residence Time (days) | See Wet Detention Methodology. |
| Greenroof and the other BMPs | Their worksheet inputs that are marked as design values | For example the Greenroof’s cistern storage. |
| Multiple BMP (BMPs in Series) | The values of each BMP in the series | Two slots of the same type are the same BMP, so they are offered once. |
Treatment Depth is not offered where the BMP works it out itself from other values and would ignore the varied one (Stormwater Harvesting calculates it from its harvest efficiency), because the curve would be flat. A basin that treats runoff routed in from other catchments is calculated with those catchments as one system, and its Treatment Depth is then its volume spread over all the area draining to it, not over its own catchment. A varied Treatment Depth would not mean what the axis says, so such a Retention BMP offers its Retention Volume (ac-ft) instead; the routing spreads the volume as usual. Exfiltration, Tree Well, Swale and the Vegetated Natural Buffer and Filter Strip (Retention) offer their Treatment Volume (ac-ft) the same way: the volume they calculate from their dimensions, which the routing spreads. Permeable Pavement, Rain Garden and Filtration that treat routed runoff offer no value of their own. A BMP set to let the routed runoff bypass it (Routing screen) sees only its own catchment and keeps Treatment Depth.
What you can plot (Y-Axis)
All six results are for the whole project, at the outlet.
| Result | Units | What it is |
|---|---|---|
| Total Outlet Nitrogen Loading | kg/yr | Nitrogen leaving the project at the outlet, after every BMP and the routing. |
| Total Outlet Phosphorus Loading | kg/yr | Phosphorus leaving the project at the outlet. |
| Provided Nitrogen Treatment Efficiency | % | 100 × (nitrogen from all catchments − nitrogen at the outlet) / nitrogen from all catchments. |
| Provided Phosphorus Treatment Efficiency | % | The same for phosphorus. |
| Provided Nitrogen Load Removed | kg/yr | Nitrogen from all catchments − nitrogen at the outlet. |
| Provided Phosphorus Load Removed | kg/yr | The same for phosphorus. |
On the two treatment-efficiency plots a dashed line marks the project’s target: the removal the analysis type requires, or, when the analysis compares pre- and post-development (General Site Information), the larger of that and the removal needed to match the pre-development load. The line is the target of the project as it is now. When you vary a Pre value, the target itself changes along the curve, but the line shows today’s target.
Applicant’s Handbook reference
Section 9.3 Determination of Required Treatment Efficiency: the required reduction is the greater of the Section 8.3 percentage for the site and the Equation 9-3 reduction that brings the post-development load down to the predevelopment load; the dashed target line is this value.
Section 9.5.1 Treatment Train Nutrient Reduction: the overall efficiency of BMPs in series “must account for the reduced loading or concentrations that are available for removal by the subsequent downstream treatment device”; this is why a Discovery Plot, which routes every change to the outlet, can differ from one BMP’s own curve.
Example: three wet ponds in series
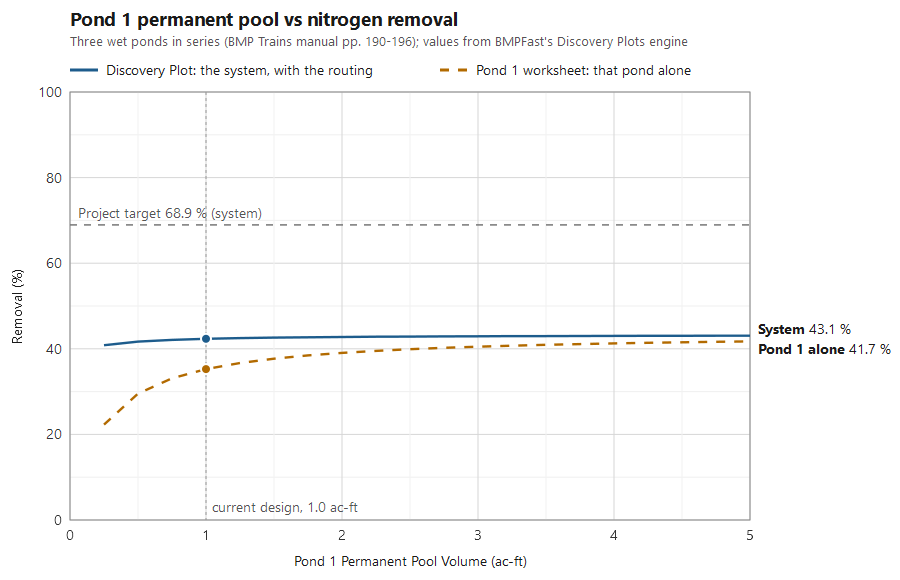
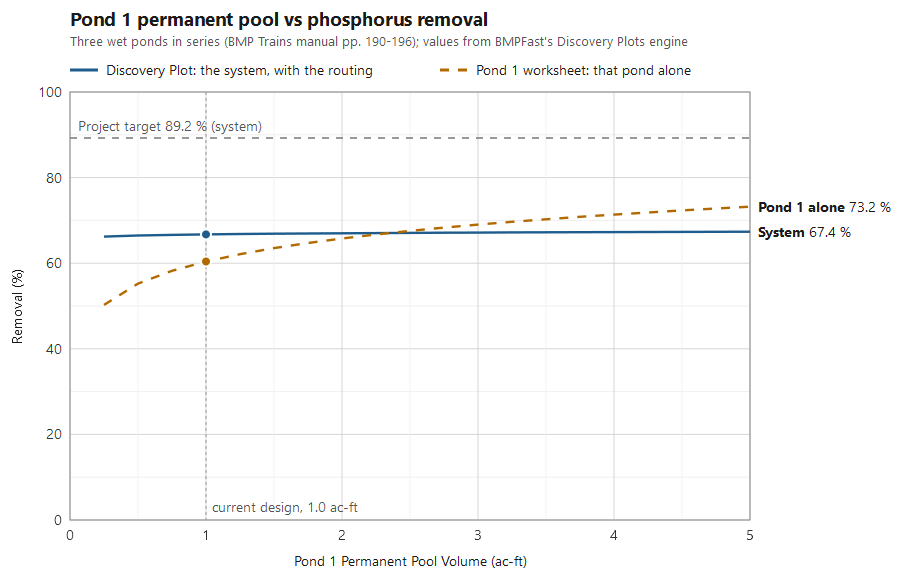
The project from the BMP Trains manual (pages 190-196) has three catchments in Zone 4, each with a wet detention pond, routed 1 → 2 → 3 → outlet. Pond 1 has a 1.0 ac-ft permanent pool and treats 20.75 ac; ponds 2 and 3 have 1.25 and 2.5 ac-ft. The plots vary pond 1’s Permanent Pool Volume from 0.25 to 5 ac-ft. The solid line is the Discovery Plot: the project’s treatment efficiency. The dashed line is pond 1’s own removal, as its worksheet shows it. BMPFast calculated both, with the Discovery Plots engine.
| Pond 1 pool (ac-ft) | Pond 1 alone, N (%) | System, N (%) | Pond 1 alone, P (%) | System, P (%) |
|---|---|---|---|---|
| 0.5 | 29.5 | 41.7 | 55.2 | 66.5 |
| 1.0 (the design) | 35.3 | 42.3 | 60.4 | 66.7 |
| 2.0 | 39.0 | 42.8 | 65.8 | 67.0 |
| 3.0 | 40.5 | 42.9 | 69.0 | 67.2 |
| 5.0 | 41.7 | 43.1 | 73.2 | 67.4 |
Going from 0.5 to 5 ac-ft raises pond 1’s own nitrogen removal by 12 points, but the project’s by only 1.4 points. Pond 1 treats 45 of the project’s 197 kg/yr of nitrogen, and what it lets through is treated again by ponds 2 and 3 (each calculated with all the runoff reaching it: its own catchment’s and the ponds’ above it), so a better pond 1 changes the outlet load only a little. The project target, 68.9 % for nitrogen and 89.2 % for phosphorus, cannot be reached by enlarging pond 1 at all: the plot shows where the effort should go instead. Varying pond 2’s Average Residence Time from 5 to 100 days, for comparison, moves the project’s nitrogen removal from 40.2 % to 45.6 %.
Source reference
FDEP and the water management districts (2010). Stormwater Quality Applicant’s Handbook: Design Requirements for Stormwater Treatment Systems in Florida, March 2010 draft (not adopted), Section 25.3 Wet Detention In Series (pages 190 to 196) (the draft, not adopted: PDF, 16 MB): works a chain of five ponds in Zone 4 in which each pond receives its own basin’s runoff and the discharge of the pond above it; the draft says its method is for ponds with annual detention times under 100 days.
The project was the same after the plots as before: 42.33 % nitrogen removal and 113.73 kg/yr at the outlet.
Other methods: ponds in series compared over a range of pond sizes: Strand Based Routing for Wet Detention in Series.
Sample problems
Worked problems solved in BMPFast, each with every input, the steps with screen captures, the program’s results, a hand check and the project file to download. Captures are for demonstration only. All of them: BMPFast sample problems.
- Discovery plot: outlet nitrogen against treatment depth
- Discovery plot: outlet phosphorus against DCIA
Related pages
- Discovery Plots: how to use the window.
- Routing: how runoff moves between catchments.
- Retention Methodology and Retention BMPs: the retention curves and each BMP’s Treatment Depth.
- Wet Detention Methodology: residence time and the pond equations.