
Description
A catchment is an area that discharges runoff water to a designated location of surface water or groundwater. Within or at the discharge location, there is potential for management by a BMP. A watershed can be separated into many catchments.
The Watershed Characteristics Worksheet is where you describe each catchment: its land use, area, curve number and directly connected impervious area (DCIA) before and after development. From these, BMPFast calculates the annual runoff and the nitrogen (N) and phosphorus (P) loads that every BMP and the routing work from. Fill in this worksheet for every catchment before you choose treatment (BMPs) or configure routing. The rainfall zone and mean annual rainfall it uses come from the General Site Information screen, so set those first.
You reach this worksheet from 1. Enter Catchment on the General Site Information screen, from the Catchments button on Select Treatment Options, from Add Catchment on Configure Catchments, and from Edit From Catchment on the Routing screen.
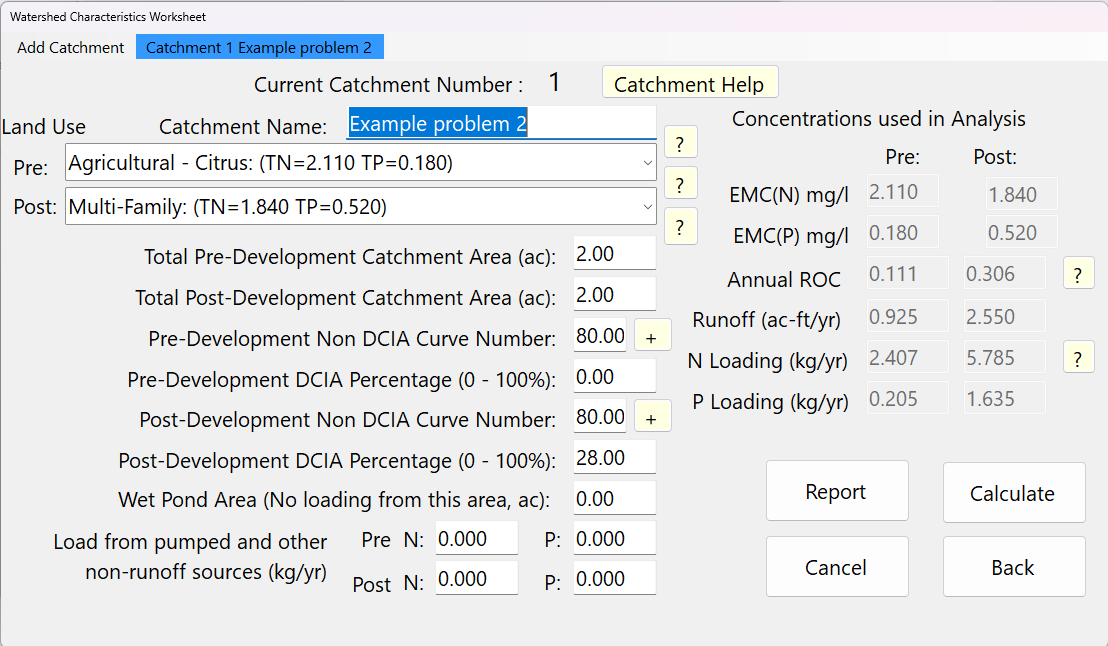
Getting started
- Type a Catchment Name. A catchment without a name shows the message “Please Enter a Name for Your Catchment Before Saving”.
- Choose the Pre and Post land use. The EMCs for that land use are filled in for you.
- Enter the pre- and post-development areas, Non DCIA curve numbers and DCIA percentages, the wet pond area and any non-runoff loads.
- Press Calculate. Check the red message line at the bottom of the screen; if it is empty, the inputs passed the checks.
- Use Add Catchment for the next catchment, or Back to return.
The results boxes are updated when you press Calculate. Changing a land use updates the EMC boxes at once, but the loads are only recalculated from the new EMCs after you press Calculate.
Inputs
| Input | Units | What it means / how it is used |
|---|---|---|
| Catchment Name: | text | Any alphanumeric text, which typically matches the stormwater professional’s designation for the project site’s catchment(s). The name appears in the menu bar (“Catchment 1 name”) and in reports. Required. |
| Current Catchment Number : | – | Read only. The number BMPFast gave this catchment. Routing refers to catchments by this number (0 is the outlet). |
| Land Use – Pre: | list | Pre-development land use. Each choice shows its EMCs, e.g. “Single-Family: (TN=1.770 TP=0.327)”, and fills the Pre EMC(N) and EMC(P) boxes. Choose User Defined Values to type your own EMCs. Locked when the pre-condition was loaded from an existing project file on General Site Information. |
| Land Use – Post: | list | Post-development land use; fills the Post EMC boxes in the same way. |
| Total Pre-Development Catchment Area (ac): | ac | The total area in acres for the catchment in the pre-development condition. The catchment is a contiguous area where all the runoff will accumulate. Used for the pre-development runoff volume. If it is 0, the pre-development ROC is set to 0. |
| Total Post-Development Catchment Area (ac): | ac | The total area in acres for the catchment, defined at a point where there is a discharge and a place for possible BMPs, in the post-development condition. |
| Pre-Development Non DCIA Curve Number: | CN | The weighted runoff curve number for the portion of the catchment that is not directly connected impervious area. Tooltip: “Enter a value between 30 and 100.” Values below 29.9 are replaced by 29.9 and values above 100 by 100, because the SCS/NRCS curve number method is not valid below 30. The + button beside it opens the Composite CN Calculator. |
| Pre-Development DCIA Percentage (0 – 100%): | % | The percentage of the total catchment area that is directly connected impervious area. Areas wet all year are not included. Values are held between 0 and 100. |
| Post-Development Non DCIA Curve Number: | CN | As for pre-development, in the post-development state (29.9 to 100). The + button opens the Composite CN Calculator for the post condition. |
| Post-Development DCIA Percentage (0 – 100%): | % | The percentage of the total catchment area that is directly connected impervious area in the post-development state. Areas wet all year (detention ponds, wetlands) are not included. 0 to 100. |
| Wet Pond Area (No loading from this area, ac): | ac | The area at the top of the permanent pool (the control elevation). For Florida sites the average annual runoff coefficient of a pond is taken as zero, because evapotranspiration is about equal to rainfall on wet ponds, so no runoff or nutrient load comes from this area. BMPFast subtracts it from the post-development area everywhere the area is used: the post-development runoff volume and the N and P loads, the area each BMP treats (its Contributing Area and Watershed Area — for example a retention basin’s Treatment Depth = volume / Contributing Area, and a stormwater harvesting system’s efficiency), and the project’s total post-development area in the reports. It must be smaller than the post-development area; if it is not, the worksheet shows a warning. |
| EMC(N) mg/l – Pre / Post | mg/L | Event mean concentration of total nitrogen. Filled from the land use and greyed out; editable only for User Defined Values, when a + button appears beside it to open the Composite EMC calculator. |
| EMC(P) mg/l – Pre / Post | mg/L | Event mean concentration of total phosphorus; as for EMC(N). For User Defined Values enter both N and P. |
| Load from pumped and other non-runoff sources (kg/yr) – Pre N:, Pre P:, Post N:, Post P: | kg/yr | Loads that do not come from rainfall runoff, such as pumped water or groundwater base flow. Each is added directly to the matching N or P loading. |
Land use choices
27 land uses with programmed EMCs are available, plus User Defined Values. Each has an arithmetic average EMC value:
| Land use | TN (mg/L) | TP (mg/L) |
|---|---|---|
| Agricultural – Citrus | 2.110 | 0.180 |
| Agricultural – General | 2.290 | 0.381 |
| Agricultural – Pasture | 3.030 | 0.593 |
| Agricultural – Row Crops | 2.500 | 0.577 |
| Conventional Roofs | 1.050 | 0.120 |
| High-Intensity Commercial | 2.400 | 0.345 |
| Highway | 1.250 | 0.173 |
| Light Industrial | 1.200 | 0.260 |
| Low-Density Residential | 1.650 | 0.270 |
| Low-Intensity Commercial | 0.930 | 0.190 |
| Mining / Extractive | 1.180 | 0.150 |
| Multi-Family | 1.840 | 0.520 |
| Single-Family | 1.770 | 0.327 |
| Undeveloped – Dry Prairie | 2.025 | 0.184 |
| Undeveloped – Marl Prairie | 0.684 | 0.012 |
| Undeveloped – Mesic Flatwoods | 1.087 | 0.043 |
| Undeveloped – Ruderal/Upland Pine | 1.694 | 0.162 |
| Undeveloped – Scrubby Flatwoods | 1.155 | 0.027 |
| Undeveloped – Upland Hardwood | 1.042 | 0.346 |
| Undeveloped – Upland Mixed Forest | 0.606 | 1.166 |
| Undeveloped – Wet Flatwoods | 1.213 | 0.021 |
| Undeveloped – Wet Prairie | 1.095 | 0.015 |
| Undeveloped – Xeric Scrub | 1.596 | 0.156 |
| General Natural | 1.220 | 0.213 |
| SJRWMD Apopka Open Space/Recreation/Fallow Crop | 1.100 | 0.050 |
| SJRWMD Apopka Forests/Abandoned Tree Crops | 1.250 | 0.080 |
| Rangeland/Parkland | 1.150 | 0.055 |
| User Defined Values | you enter both values | |
Applicant’s Handbook reference
Section 9.2.2 Calculating Predevelopment and Post-development Stormwater Nutrient Loading (Table 9.2 Standardized Statewide Stormwater Nutrient EMC Values): the 22 land uses of Table 9.2 are in this list with the same TN and TP values; Conventional Roofs, Mining / Extractive, General Natural and the two SJRWMD Apopka land uses are not in Table 9.2, so their basis (for example the applicable AH Volume II, which paragraph a also names) must be given with the application.
Source reference
Harper, H.H. and Baker, D.M. (2007). Evaluation of Current Stormwater Design Criteria within the State of Florida. Final report, FDEP Contract S0108, Table 4-17 (Summary of Literature-Based Runoff Characterization Data for General Land Use Categories in Florida, page 4-26) (link): gives Mining / Extractive 1.18 mg/L TN and 0.15 mg/L TP, the values BMPFast uses for that land use, which is not in Table 9.2.
BMPFast method (land use table, LanduseTable.cs): Conventional Roofs (1.05 / 0.12), General Natural (1.22 / 0.213) and the two SJRWMD Apopka land uses are carried in the program’s land use list without a cited study; the Apopka names point to St. Johns River Water Management District data for the Lake Apopka basin.
Event Means Concentrations (EMCs)
If pre- or post-development EMCs are not known, user-defined values may be entered. Select User Defined Values as the land use; the EMC boxes for that condition become white (editable). Nitrogen and Phosphorus values must both be entered for user-defined categories.
Applicant’s Handbook reference
Section 9.2.2 Calculating Predevelopment and Post-development Stormwater Nutrient Loading, paragraph b: an applicant may propose TN and TP EMCs from regional or local studies accepted by the Agency, and the study must be submitted with the application; User Defined Values is where such EMCs are entered.
For mixed land uses within a catchment, a weighted EMC based on annual runoff can be calculated with the + calculator button beside each EMC box (see Composite EMCs). The calculator buttons are only visible when “User Defined Values” is selected.
DCIA Disconnection and Curve Number (CN) Adjustment
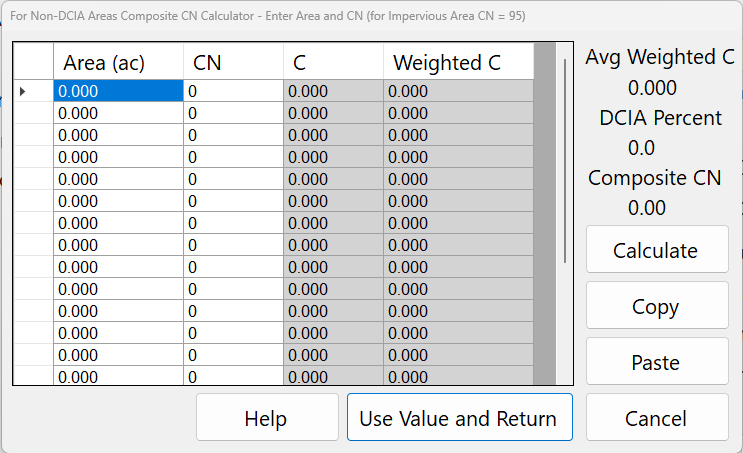
If directly connected impervious area (DCIA) is disconnected and routed to pervious areas before discharge, adjustments are made to the curve number calculations using the CN calculator support button (+) adjacent to the Non-DCIA CN input (see Composite CN Calculator).
In this example, the post-development CN is higher than the pre-development CN because the disconnected impervious area is assigned a CN of 95. This CN value reflects runoff from rainfall greater than 0.1 inches.
When 1.813 acres of DCIA are disconnected:
- Pervious area = 15.222 acres
- DCIA = 3.715 acres (17.9% of total area; 0.179 × 20.75 acres)
- Composite CN weighted by runoff volume = 76.12
A simple average CN (68 + 95) / 2 = 81.5 would produce a higher runoff volume than the composite weighted runoff CN. An area-weighted CN of 70.87 would produce a lower runoff volume than the composite weighted runoff CN. Therefore, composite weighting by runoff volume is required.
Applicant’s Handbook reference
Section 9.2.1 Calculating Predevelopment and Post-development Hydrology, paragraph b: DCIA is impervious area directly connected to the conveyance system, as a percentage of the total area; impervious area that flows over at least 10 feet of undisturbed pervious area (HSG A or B) or 20 feet (other soils) is Non-DCIA. The handbook gives no rule for the curve number of disconnected area; the runoff-weighted composite CN is BMPFast’s method.
Source reference
BMPFast method (Composite CN Calculator, frmCompositeCN): the disconnected impervious area is given CN 95 and the parts are weighted by the runoff each produces; the program gives no source for 95.
Harper, H.H. and Baker, D.M. (2007). Evaluation of Current Stormwater Design Criteria within the State of Florida. Final report, FDEP Contract S0108, Section 4.2.1, page 4-28 (link): builds its non-DCIA curve number with CN 98 for impervious area that is not directly connected: nDCIA CN = [CN × (100 − Imp) + 98 × (Imp − DCIA)] / (100 − DCIA); BMPFast’s 95 differs from this.
Results
The grey boxes on the right are results, shown for Pre and Post:
| Result | Units | Meaning |
|---|---|---|
| Annual ROC | 0–1 | Annual runoff coefficient: the fraction of the mean annual rainfall that leaves as runoff, read from the ROC table for the project’s rainfall zone at the Non DCIA CN and DCIA percentage. |
| Runoff (ac-ft/yr) | ac-ft/yr | Average annual runoff volume. |
| N Loading (kg/yr) | kg/yr | Calculated nitrogen loading from the EMC and runoff volume, plus any non-runoff N load. |
| P Loading (kg/yr) | kg/yr | Calculated phosphorus loading, plus any non-runoff P load. |
How the results are calculated
C (Annual ROC) = ROC table(rainfall zone, Non DCIA CN, DCIA %)   (linear interpolation)
Pre Runoff  (ac-ft/yr) = C_pre  × Pre Area × Rainfall / 12
Post Runoff (ac-ft/yr) = C_post × (Post Area − Wet Pond Area) × Rainfall / 12
N Loading (kg/yr) = 1.233 × EMC(N) × Runoff + non-runoff N load
P Loading (kg/yr) = 1.233 × EMC(P) × Runoff + non-runoff P load
Rainfall is the mean annual rainfall (in/yr) from General Site Information. 1.233 converts mg/L × ac-ft to kg (1 ac-ft = 1,233 m³). The pre- and post-development loads also set the required treatment efficiency for analysis types that compare them (Net Improvement).
Applicant’s Handbook reference
Section 9.2.1 Calculating Predevelopment and Post-development Hydrology, paragraphs c and f (Equation 9-1): the ROC is read from Appendix N (Mean Annual Runoff Coefficients (ROC Value) as a Function of DCIA Percentage and Non-DCIA Curve Number) for the zone, with linear interpolation, and annual runoff = area × rainfall × ROC × 1/12; BMPFast does the same, except that it takes the Wet Pond Area out of the post-development area.
Section 9.2.2 Calculating Predevelopment and Post-development Stormwater Nutrient Loading, paragraph c (Equation 9-2): load = runoff volume × EMC with unit conversions (the handbook prints it in lb); BMPFast uses kg (1.233 kg per mg/L·ac-ft) and adds any non-runoff load you enter, which the handbook does not include.
Source reference
Harper, H.H. and Baker, D.M. (2007). Evaluation of Current Stormwater Design Criteria within the State of Florida. Final report, FDEP Contract S0108, Appendix C (Calculated Annual Runoff Coefficients for the Designated Meteorological Zones as a Function of Curve Number and DCIA) and Section 4.2.1 (link): the annual runoff coefficient (ROC) tables were made by continuous simulation with the SCS curve number method, runoff from DCIA starting after 0.1 in of rain; BMPFast reads these tables for every catchment, and Appendix N of the handbook reproduces them.
BMPFast method (wet pond area; Ron, 2026-10-05): the wet pond’s own area gives no runoff, because rainfall on a Florida pond about equals its evaporation, so BMPFast takes it out of the post-development area everywhere the area is used.
Buttons and features

| Button / menu | What it does |
|---|---|
| Add Catchment (menu bar) | Stores the current catchment and opens the Create New Catchment dialog (below). |
| Catchment 1 …, Catchment 2 … (menu bar) | One item per catchment, with its name. Clicking one stores the catchment on screen and shows the chosen one. The highlighted item is the catchment you are editing. |
| Catchment Help | Opens this page. |
| ? beside Land Use (top) | Opens the General Land Use Categories page on bmpfast.com. |
| ? beside Land Use (middle) – “Natural Community Summary” | Opens the Natural Community Summary table in the report viewer. |
| ? beside Land Use (bottom) – “FLUCCS Code Summary” | Opens the FLUCCS (Florida Land Use, Cover and Forms Classification System) code summary in the report viewer. |
| + beside each Non DCIA Curve Number | Opens the Composite CN Calculator for that condition. If you accept its result, it is written into the curve number box. |
| + beside each EMC (User Defined Values only) | Opens the Composite EMC calculator for that condition and nutrient. If you accept its result, it is written into the EMC box. |
| ? beside Annual ROC – “Annual Runoff Fraction C” | Shows the table of annual runoff coefficients (“Rational C Values”) for the project’s rainfall zone, by Non DCIA CN (rows) and percent DCIA (columns), in the report viewer. |
| ? beside N Loading – “Mass Loading Methods” | Opens the Mass Loading Methods page on bmpfast.com. |
| Calculate | Stores all values on the screen in the project (in memory; it does not save the project file to disk), recalculates the catchment and shows the results and any error message. |
| Report | Opens the Catchment Report for this catchment in the report viewer (its inputs, ROC, runoff and loads), which you can print or copy. |
| Back | Stores the values, recalculates and closes the worksheet. |
| Cancel | Closes without storing what is in the boxes. Values already stored by Calculate, by switching catchments or by Add Catchment are kept. |
Multiple Catchments
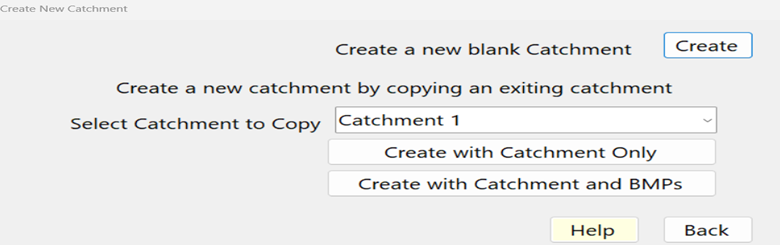
For sites with multiple catchments, additional catchment worksheets may be created using Add Catchment at the left of the menu bar at the top of the worksheet. It opens the Create New Catchment dialog:
| Control | What it does |
|---|---|
| Create (under “Create a new blank Catchment”) | Adds a new, empty catchment with the next number, adds it to the menu bar and shows it on the worksheet. |
| Select Catchment to Copy | The existing catchment to copy (Catchment 1, Catchment 2, …). |
| Create with Catchment and BMPs | Adds a new catchment with the same land uses, areas, curve numbers, DCIA percentages, EMCs and wet pond area as the selected one, and copies every BMP defined on it. The copy is called “Copy of” and the original’s name (for example “Copy of North Lot”; “Copy of Catchment 2” when the original has no name); rename it in Catchment Name. |
| Create with Catchment Only | As above, but no BMPs are copied. |
| Back | Closes the dialog without adding a catchment. |
| Help | Opens this page. |
Catchments cannot be deleted. To leave one out of the analysis, disable it on the Routing screen (Configure Catchments → Edit).
Messages and limits
Problems are shown in red at the bottom of the worksheet after Calculate:
- “Please Enter a Name for Your Catchment Before Saving”.
- “The BMP Area Cannot Exceed the Total Post Development Area” – the Wet Pond Area is larger than the post-development area.
- “For this Analysis Method (…) you must specify a Pre watershed condition” – Net Improvement and Specified Removal Efficiency analyses need a pre-development land use.
- Curve numbers are held between 29.9 and 100 and DCIA percentages between 0 and 100 when they are read from the screen.
- When the pre-development condition was taken from an existing project file (General Site Information), the Pre land use, area, Non DCIA CN and DCIA percentage are locked.
Frequently Asked Questions
Q: What post condition Non DCIA CN should be used with Disconnected DCIA?
A: At this time, it is recommended that the CN for HSG “A” or “B” soils is not adjusted in the post condition when there is runoff from an adjacent area. This is because the soils recover some of their capacity for maximum storage in the time between runoff events due primarily to the low volume rain events and the storage volume being significant in “A” or “B” soils. While we recognize there may be a change, there is no research to support the change.
For background information, CN serves as a proxy for the generation of runoff volume and the maximum soil storage. For one rainfall/runoff event, it is understood that there is an adjustment based on an antecedent wet or dry condition (USDA National Engineering Handbook, Sec 4, 1972). This adjustment is applied to the calculation of runoff from one storm event, not to the generation of runoff from all rainfall events. Nevertheless, there is evidence that the CN value can be adjusted.
In a year in Florida, there are many small-volume rain events (typically 90% < 1 inch). When there is a large-volume rain, it is rare, and the volume does not significantly affect the cumulative annual runoff or capture, given the storage volume typically encountered in the “A” and “B” type soils. In fact, all events over 4 inches in Florida usually account for only about 1-4 % or the average annual runoff from soils.
To show a significant maximum storage volume, the CN method is used. The CN value for the maximum soil storage of 4 inches is approximately 71.4, and for a CN of 50, the maximum soil storage is 10 inches. Also, recall that soil types “C” and “D” have lower maximum soil storage relative to “A” and “B” soils. As an example, the maximum storage (S’) for a CN of 80 is 2.5 inches or S’= (1000/80)-10 = 2.5. Typically, for “C” and “D” soils, here represented by a CN value of 80, it is recommended that separate calculations should be done for a CN value as used to calculate the runoff.
Source reference
USDA Soil Conservation Service (1972). National Engineering Handbook, Section 4, Hydrology; and NRCS (1986). Urban Hydrology for Small Watersheds, Technical Release 55: the curve number method, the antecedent moisture adjustment and the maximum soil storage S = 1000 / CN − 10 come from this method; Harper and Baker (2007) used it, with the TR-55 curve numbers, to build the runoff coefficient tables BMPFast reads.
Q: Does the software calculate any average annual runoff from a non-directly connected pervious area in soil type “A”?
A: Yes, annual runoff is calculated separately from a non-directly connected pervious area for any soil condition. To show the results, press the ? beside Annual ROC on this worksheet, or the Tools button on Select Treatment Options and then “ROC Rational Coefficient Lookup Table”. These ROC tables were developed using a change in the CN as reflected by previous rainfall volumes and recovery. For rain zone 2 and using a Non DCIA CN of 50, and a DCIA of 0%, the average annual runoff from this area is 1.5% of the average annual rain. This, however, does not include the added runoff from the adjacent area.
At this time, it is recommended that there is no change in the CN due to the added runoff because there is no evidence to support how much of a change is necessary for the many soil and adjacent runoff volumes that are possible. When there is evidence for a change, it should be considered. The BMPFast software allows for Non-DCIA CN input as an open response block.
Impervious area that is not directly connected: curve number 95 to 98, the designer’s choice (Ron Eaglin, October 19, 2026). Harper and Baker (2007), Section 4.2.1, page 4-28, the source of BMPFast’s runoff tables, use 98; BMPFast’s calculator titles say 95. A higher value gives more runoff and a higher post-development load: say which you used.
Sample problems
Worked problems solved in BMPFast, each with every input, the steps with screen captures, the program’s results, a hand check and the project file to download. Captures are for demonstration only. Every BMP and method has at least two: see the BMPFast sample problems (58 problems, grouped by BMP and method).