
BMPFast shows every report in the Report Viewer (the “BMPFast Reports” window): a formatted page you can read, print, save as a web page (HTML) or copy into another program. Reports are calculated from the project at the moment you open them, so they always match the current inputs. This page explains the reports you open from General Site Information and the Report Viewer’s menu. Many other screens (each BMP’s report and Equations page, Sizing, Cost Analysis, routing) also open their reports in the same viewer, with the same menu.
Opening reports from General Site Information
| Button | Report | Available when |
|---|---|---|
| 4. Summary Report | Summary Report (described below). | At least one catchment with a BMP |
| 5. Complete Report | Complete Report (not including cost): the routing table first, then the site and catchment information for all catchments, a detailed report and routing balance for each catchment, and finally the Summary Report with each catchment’s details. | At least one catchment |
| 6. Cost Analysis | Opens the Cost Analysis hub; cost reports are opened from there. | At least one catchment |
| 8. Custom Reports ▼ → AH Vol 1, Sec 9, App M-O | AHVI Section 9 Compliance Report (described below). | At least one catchment with a BMP |
Report Viewer menu
| Menu | What it does |
|---|---|
| Prints the report shown (Windows print dialog). | |
| Save | Saves the report shown as an HTML file (default name report.html, in Documents\BMPFast). The file opens in any web browser. |
| Copy | Copies the entire report to the clipboard, not just text you have selected, then says “Report has been copied to the clipboard as HTML text”. Paste it into a word processor or spreadsheet. |
| Help | Opens this page. |
| Reports | Replaces the report shown with another report of the project (list below). Each is recalculated from the current project when chosen. The window title changes to the report’s name. |
| Back | Closes the Report Viewer. |
The Reports menu
| Item | What the report shows |
|---|---|
| Summary Report | The same Summary Report as button 4. |
| Flow Balance Report | One report for each strand (a chain of catchments routed in series): for retention in series, the volumes and effectiveness of the combined system; for detention in series, the residence time (ART) and effectiveness; otherwise the flow balance of the catchment routing (flow, nitrogen and phosphorus in and out). Any routing errors are listed at the end. |
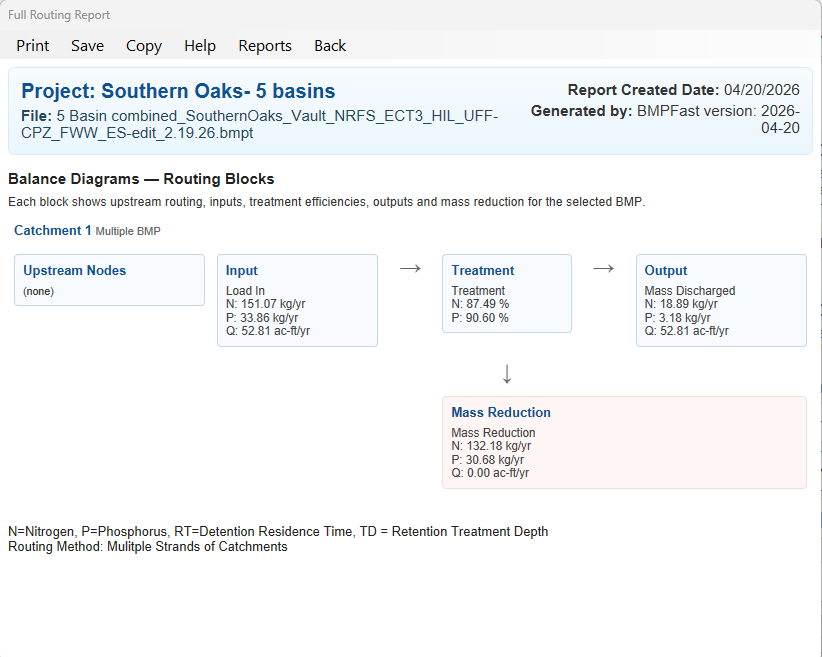
| Full Routing Diagram | Balance blocks: a balance block for each catchment (what flows in and out, with its nitrogen and phosphorus), grouped strand by strand with each strand’s outlet summary, and a note on the routing method at the bottom. |
| Routing Diagram | Each chain of catchments drawn as a column of blocks, upstream at the top, ending at the outlet. Shows “No routing defined.” when catchments have not been configured, and lists routing errors. |
| Catchment Report | The watershed characteristics (pre- and post-development land use, area, runoff coefficients, loads) of every catchment. |
| AH Vol 1, Sec 9, App M-O | The AHVI Section 9 Compliance Report (below). |
For how catchments are routed and what the routing reports mean, see Configure Catchments.
Report header
Reports opened from General Site Information start with a header showing the Project name, the File name, Prepared By, the Date and the BMPFast version (Generated by). Project Name and Prepared By are entered on General Site Information. Reports chosen from the Reports menu are shown without this header, except AH Vol 1, Sec 9, App M-O.
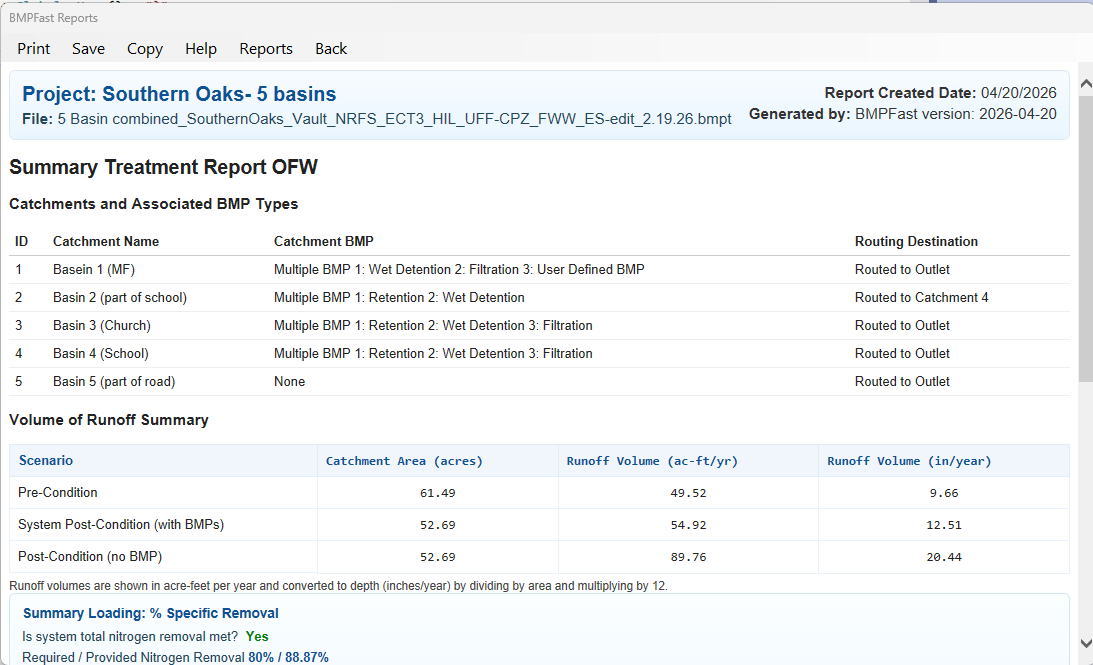
Summary Report
Titled “Summary Treatment Report:” followed by the analysis type. In order:
- Catchments and Associated BMP Types — each catchment, its BMP and where it routes.
- Volume of Runoff Summary — catchment area (acres) and annual runoff volume (ac-ft/yr and in/yr) for the Pre-Condition (not shown for BMP Analysis), the Post-Condition (no BMP) and the System Post-Condition (with BMPs). The area is the same in both post rows: BMPs do not change the area, only how much runoff leaves it. The with-BMP volume is what leaves the system at the outlet, so it is smaller only when BMPs keep water out of the surface discharge (retention, exfiltration, harvesting); with BMPs that discharge to surface water, such as wet detention and surface discharge filtration, the two volumes are equal.
- Summary of Removals — the system removal for TN and TP and Yes/No answers, depending on the analysis type: % Specified Removal (“Is specified removal for total nitrogen removal met?”) compares the system removal with the analysis type’s specified %; Pre vs. Post Removals (“Is removal (pre<=post) … met?”) compares it with the reduction needed for post-development discharge not to exceed pre-development (an asterisk means the post load is already less than the pre load); Maximum Removals uses the greater of the two. A section that does not apply says so (for example “There are no pre/post targets for this analysis type.”).
- Nitrogen & Phosphorus Loading — total pre and post loads, target and provided discharge loads and load reductions (kg/yr), and the percent load reduction. The target load reduction is the analysis type’s specified removal, or for Net Improvement the reduction that brings the post load down to the pre load (“*” when the post load is already below the pre load). When Conduct Groundwater Discharge Analysis is Yes it adds the average annual recharge and the N and P recharge load and concentration. Projects made with the former Open Pre BMP (before BMPFast 1.1.10) may also show an Existing N and P Discharge.
- Any routing errors found in the catchment configuration.
Applicant’s Handbook reference
Section 9.3 Determination of Required Treatment Efficiency: the percent reduction for post to equal pre (Equation 9-3) is compared with the Section 8.3 percentage, and “The greater load reduction (the more protective) will be the requirement”; Maximum Removals is that comparison. BMPFast counts a target as met when the removal, rounded, equals or exceeds it.
A target counts as met when the system removal, rounded, is equal to or greater than the target.
Source reference
BMPFast method (BMP.TargetMet): comparing the rounded removal with the rounded target is BMPFast’s rule.
AHVI Section 9 Compliance Report
Presents the project’s nutrient load reduction calculations in the order and terms of the ERP Applicant’s Handbook Volume I (Sections 8–9: Tables 9.1 and 9.2, Equations 9-1 to 9-5, and Appendices M, N and O), for submittal to a reviewing agency. Its sections are: Method Statement; 1. Project Inputs; 2. Predevelopment and Post-development Hydrology; 3. Predevelopment and Post-development Nutrient Loading; 4. Required Treatment Efficiency; 5. Best Management Practices and Treatment Efficiencies (with the BMP design inputs as entered); 6. Treatment Train Routing; 7. Post-development Discharge and Compliance; 8. Method Basis and References. It recalculates nothing except unit conversions (for example kg to lb), so its numbers always agree with the Summary and Complete reports.
Applicant’s Handbook reference
Section 9.1 Calculating Required Nutrient Load Reduction to Section 9.5 Best Management Practices (BMPs) for Stormwater Treatment: the report follows these sections in order, with Section 8.3 for the standard and Appendices M, N and O.
Section 9.2.1 Calculating Predevelopment and Post-development Hydrology: “If modeling is used to determine hydrology, at a minimum the applicant shall submit the program used, inputs, and outputs”; the report names BMPFast and lists the inputs and outputs for that reason.
Source reference
Harper, H.H. and Baker, D.M. (2007). Evaluation of Current Stormwater Design Criteria within the State of Florida. Final report, FDEP Contract S0108, Appendices C and D and Figures 5-9 and 5-10 (link): the technical basis of the report’s runoff coefficients, dry retention efficiencies and wet detention equations, as its method statement says.
Notes
- If Save fails, BMPFast says “Error occurred in save”. Check that the file is not open in another program and that you can write to the folder, or choose another name or folder.
- Reports reflect the inputs at the moment they are opened. If you change inputs while a report is open, choose the report again from the Reports menu (or close and reopen it) to see the new results.
Whether a target is met: rounding. BMPFast compares the removal with the target after rounding both to whole percent (the pre/post target to 3 decimals), rounding up from .5: a removal of 79.5 % counts as 80 % and meets an 80 % target. The Applicant’s Handbook gives no rounding rule; the rounding is BMPFast’s (Ron Eaglin, October 19, 2026).
Cost reports. The Complete Report does not include cost. The cost reports are the Unit Cost Summary Report and the Full Cost Report (per BMP), from 6. Cost Analysis (Cost Analysis). In BMPFast 2: a treatment’s Cost tab, and a routing’s Report tab (Cost summary, Full cost report).
Printing a report changes no result in BMPFast 2 (Ron Eaglin, October 19, 2026): the Summary and Complete reports work out their figures and leave the project’s numbers as they were.
Sample problems
Worked problems solved in BMPFast, each with every input, the steps with screen captures, the program’s results, a hand check and the project file to download. Captures are for demonstration only. All of them: BMPFast sample problems.