
All programs › BMPFast › BMPFast 2 sample problems
Retention efficiency between two tables: Zone 4, 0.8 in
CN 80, DCIA 70 %, 0.8 in in Zone 4: interpolated between table depths.
Help: Retention Efficiency Lookup Tables (help page 4325) · Download the .bmpf · Link to Solution in BMPFast Version 1
1The problem
A 5-acre commercial site in Zone 4 (CN 80, DCIA 70 %). Read the capture of a 0.8-inch depth, which falls between two tabulated depths.
| Input | Value | Source |
|---|---|---|
| Project (General Site Information) | ||
| Meteorological zone | Florida Zone 4 | Zone map (help page 815) |
| Mean annual rainfall | 52 in | Mean annual rainfall map (help page 815) |
| Performance standard (analysis type) | BMP Analysis | Site (illustrative) |
| Catchment 1: Commercial site (Watershed Characteristics) | ||
| Land use, pre / post | Undeveloped - Mesic Flatwoods / High-Intensity Commercial | Site (illustrative) |
| Area, pre / post | 5 / 5 ac | Site (illustrative) |
| Non-DCIA curve number, pre / post | 70 / 80 | Site (illustrative) |
| DCIA, pre / post | 0 / 70 % | Site (illustrative) |
| EMC TN, pre / post | 1.087 / 2.400 mg/L | BMPFast land use table (AH Vol I Table 9.2) |
| EMC TP, pre / post | 0.043 / 0.345 mg/L | BMPFast land use table (AH Vol I Table 9.2) |
Find: the capture efficiency from the tables, and the same value from the Retention worksheet.
2Steps in BMPFast 2
Start BMPFast 2 and choose File ▸ New project. The tree on the left opens on the project (General Site Information). On its Entry tab enter: Project name Retention efficiency lookup: Zone 4, between tables; Meteorological zone Florida Zone 4; Mean annual rainfall 52.00 in; Type of analysis BMP Analysis. (To follow along with the finished project instead, choose File ▸ Open and open
lookup-table-zone4-between.bmpffrom Files below.)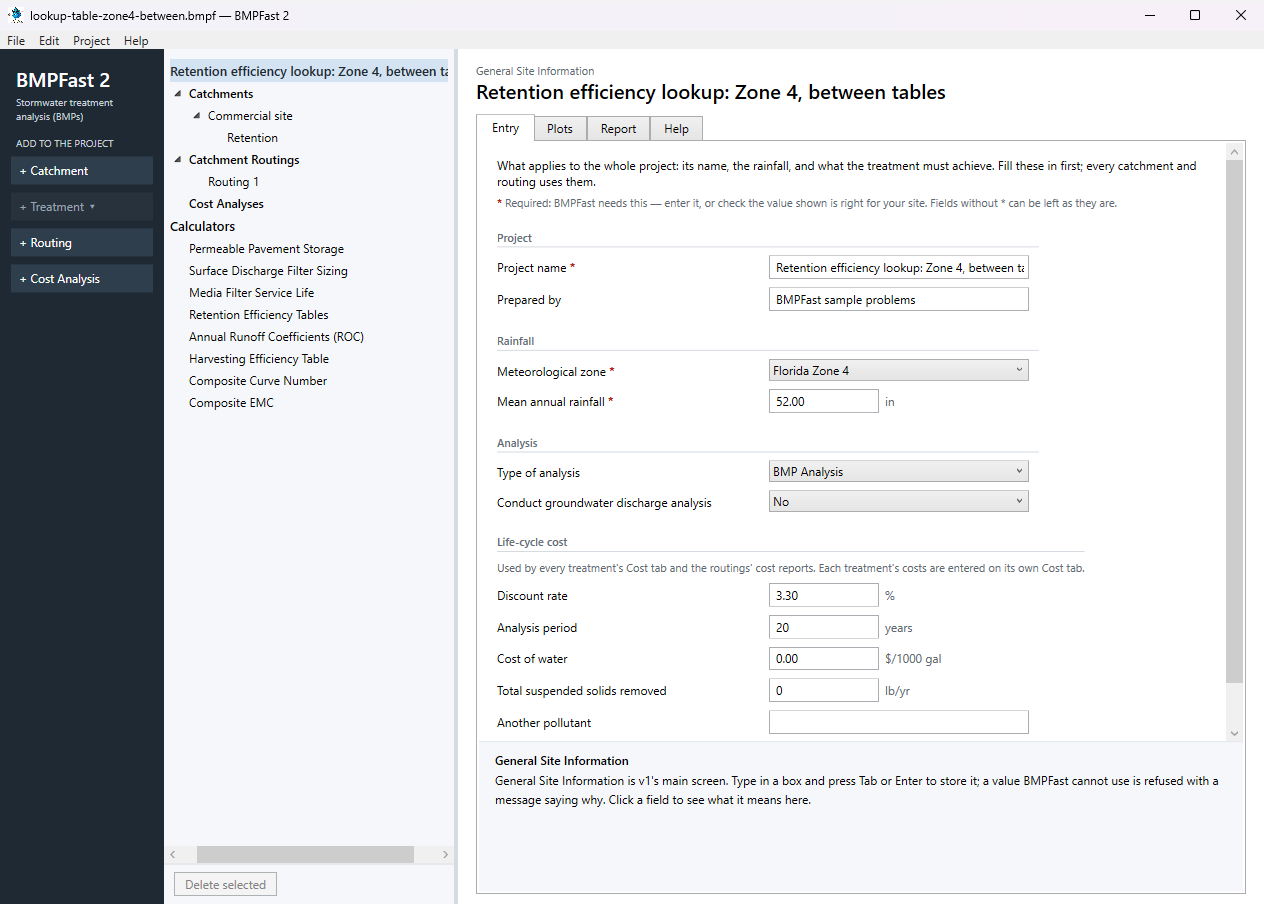
General Site Information: the project’s Entry tab. In the tree open Calculators and select Retention Efficiency Tables. On its Entry tab choose the Rainfall zone Florida Zone 4, type 0.8 in Treatment depth, 80 in Non-DCIA curve number and 70 in DCIA, then press Find the efficiency beside Retention efficiency. BMPFast 2 says: “Retention efficiency 65.7 % at 0.80 in, curve number 80.0, DCIA 70.0 %.” Between the tabulated depths it interpolates; the Report tab shows the table it read.
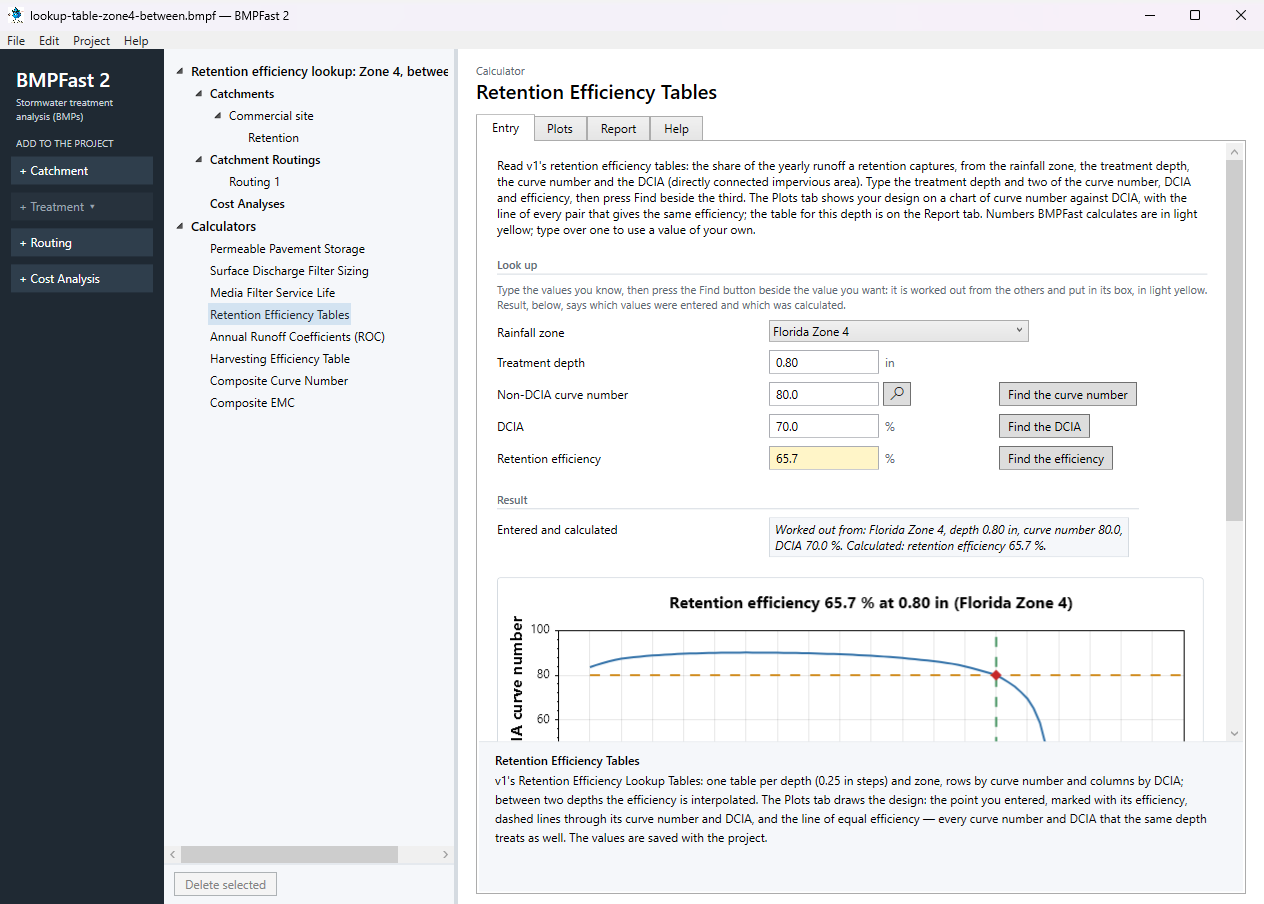
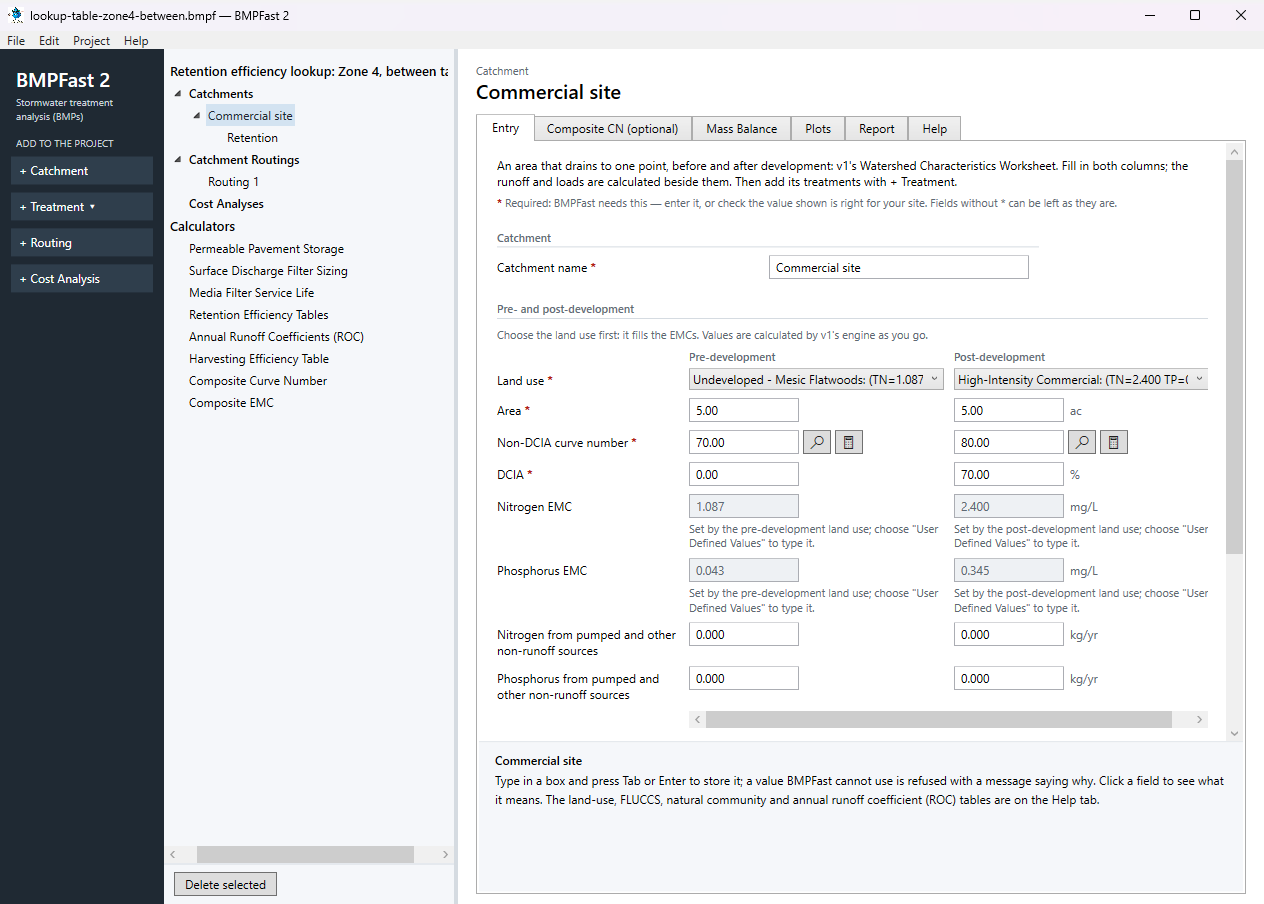
Retention Efficiency Tables: the efficiency found from the zone, depth, curve number and DCIA. Press Add Catchment (left). Select the new catchment in the tree; on its Entry tab type the name Commercial site and enter: Land use (pre) Undeveloped - Mesic Flatwoods; Land use (post) High-Intensity Commercial; Area (pre) 5.00 ac; Area (post) 5.00 ac; Non-DCIA curve number (pre) 70.00; Non-DCIA curve number (post) 80.00; DCIA (post) 70.00 %. Leave the other boxes as they are (0 or blank). BMPFast 2 calculates as you type; scroll down to Calculated for the results after development: Annual runoff coefficient (ROC) (post) 0.615; Runoff volume (post) 13.325 ac-ft/yr; Nitrogen load (post) 39.431 kg/yr; Phosphorus load (post) 5.668 kg/yr.
The catchment Commercial site: its Entry tab. With Commercial site selected, press Add Treatment and choose Retention. On its Entry tab type the Treatment name Retention (BMPFast 2 starts it as “Retention 1”) and enter: Provided retention volume 0.333 ac-ft; Time to recover the design volume 72.00 hr. The results are calculated as you type: Treatment depth 0.799 in; Nitrogen removal provided 65.65 %; Phosphorus removal provided 65.65 %. (A volume of 0.333 ac-ft over the catchment is a treatment depth of 0.799 in: the depth looked up above.)
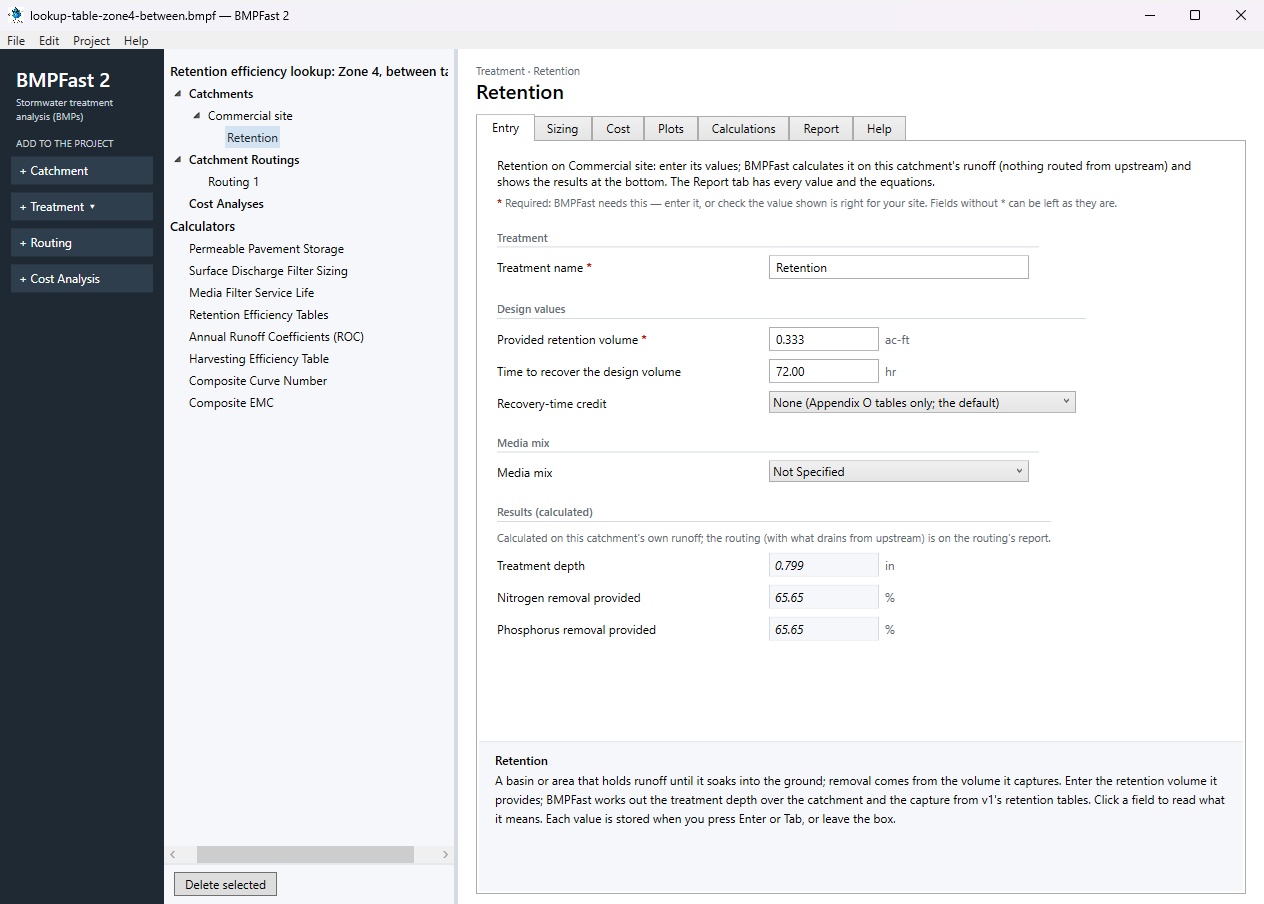
The treatment Retention: its Entry tab. Open the treatment’s Report tab: its inputs and removal, as a report to print or save.
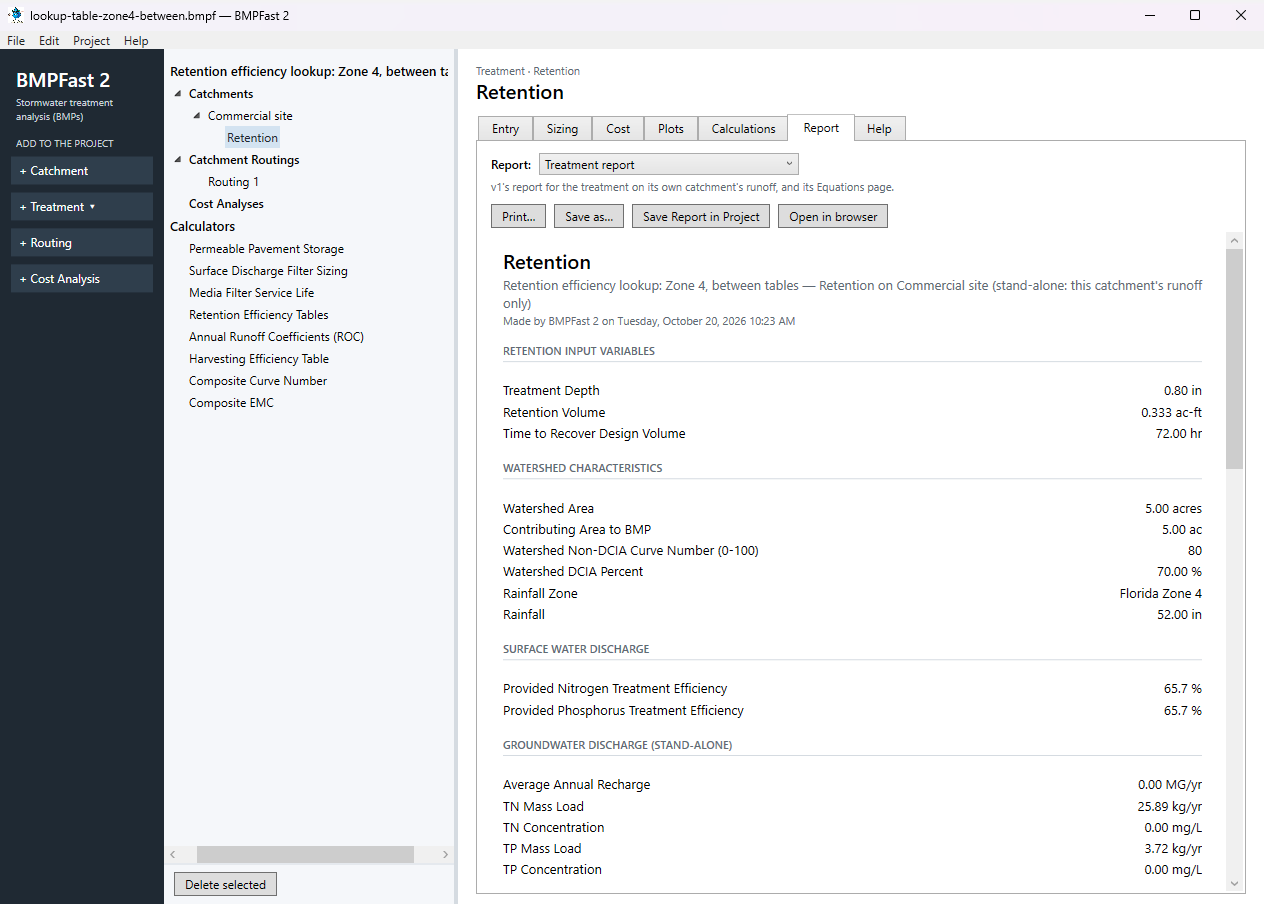
The treatment Retention: its Report tab. Press Add Routing (left). BMPFast 2 adds Routing 1 under Catchment Routings, with every catchment draining to the outlet and no treatment; a project can have several routings, compared side by side. On its Entry tab (How the routing is calculated Strand routing (v1's routing; use this for permits)) set each catchment as in this table:
Catchment Drains to Treatment used Commercial site Outlet Retention A catchment is treated only by the treatment its routing uses.
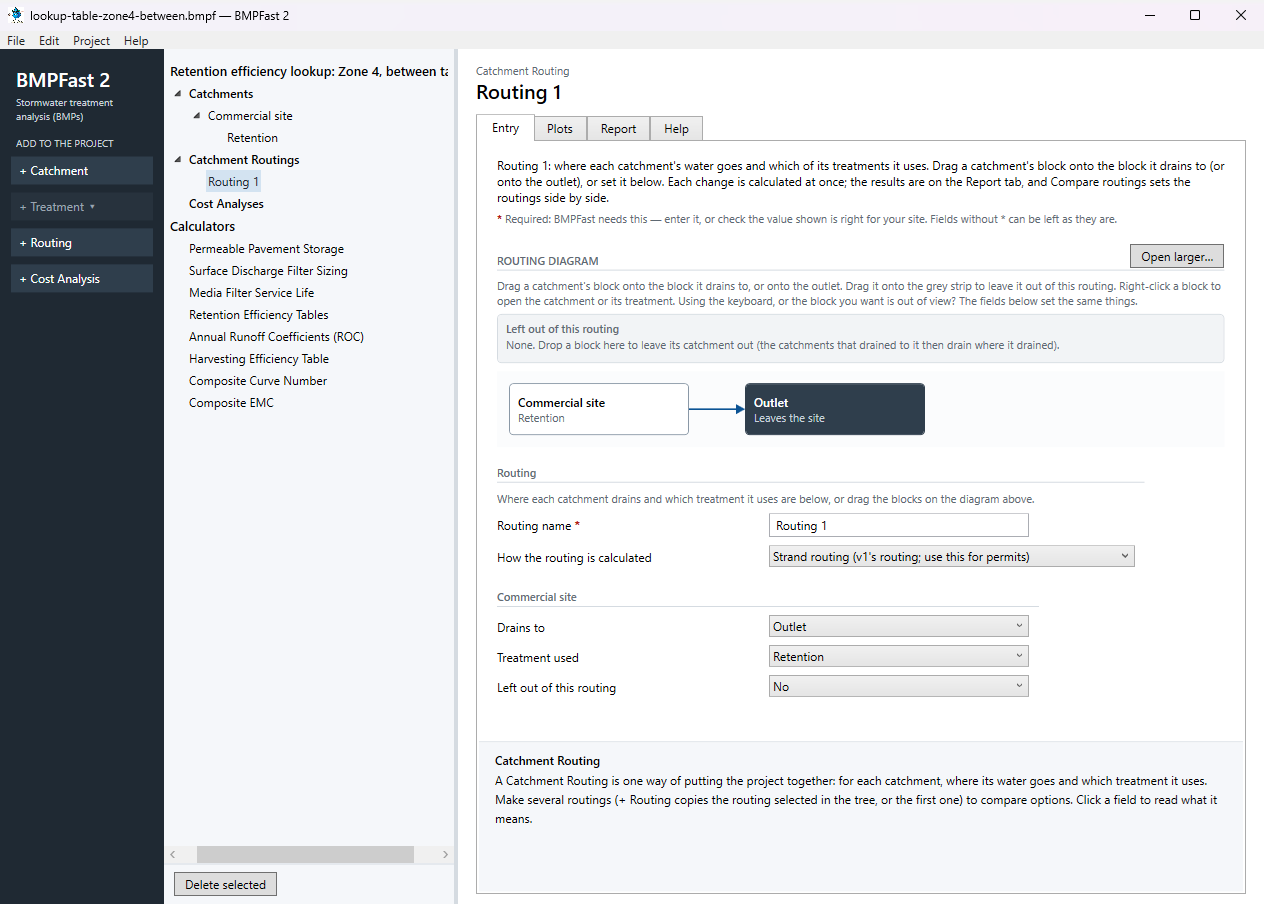
The routing’s Entry tab: where each catchment drains and the treatment it uses. Open the routing’s Report tab. Results shows the loads leaving the site, the removal provided and required, and whether the performance standard is met; the list at the top of the tab has v1’s reports for the same routing (Summary, Complete, Flow Balance, AH Vol I Sec 9 compliance). Save the project with File ▸ Save; compare it with the .bmpf under Files.
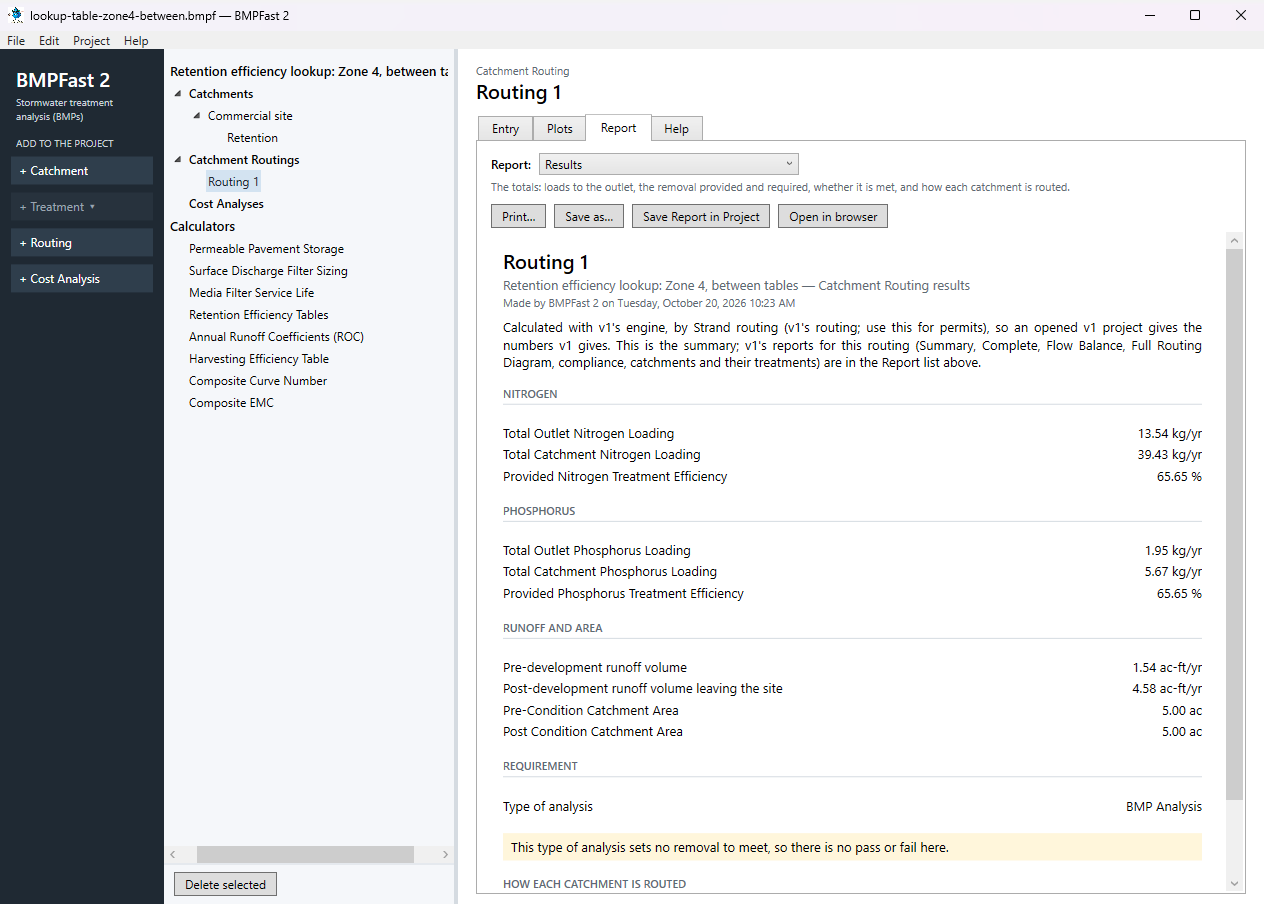
The routing’s Report tab: Results.
3Results
The calculator
| On the screen | Value |
|---|---|
| Rainfall zone | Florida Zone 4 |
| Treatment depth | 0.80 in |
| Non-DCIA curve number | 80.0 |
| DCIA | 70.0 % |
| Retention efficiency | 65.7 % |
| Result | Value |
|---|---|
| Efficiency from the tables | 65.68 % |
| Retention treatment: treatment depth | 0.799 in |
| Retention treatment: capture | 65.65 % |
The table the calculator read
Open this report on its own page.
BMPFast 2 and BMPFast (v1)
| Result | BMPFast 2 | BMPFast (v1), its page | |
|---|---|---|---|
| Nitrogen leaving the site | 13.544 kg/yr | 13.544 kg/yr | same |
| Phosphorus leaving the site | 1.947 kg/yr | 1.947 kg/yr | same |
| Site removal, nitrogen | 65.652 % | 65.652 % | same |
| Site removal, phosphorus | 65.652 % | 65.652 % | same |
| Commercial site: Retention removal, nitrogen | 65.652 % | 65.652 % | same |
| Commercial site: Retention removal, phosphorus | 65.652 % | 65.652 % | same |
Every number BMPFast 2 gives for this problem is the same as BMPFast (v1)’s, to three decimals.
4Check
Same tables, same answer. The calculator gives 65.68 % and the Retention treatment, at 0.799 in, gives 65.65 % — the same. The treatment’s depth, 0.7992 in, is the volume’s rounding of 0.8 in, so its capture is a hair lower. Between two tabulated depths BMPFast interpolates linearly; between curve number rows and DCIA columns it interpolates too (AH Vol I Appendix O; help page 4325).
5Files
- lookup-table-zone4-between.bmpf: the project, saved by BMPFast 2. Save it (your browser puts it in Downloads), then in BMPFast 2 choose File ▸ Open and open it. Opened again and calculated, it gives the numbers on this page.
- lookup-table-zone4-between.bmpt: the same project as BMPFast (v1) saved it. BMPFast 2 opens it too (File ▸ Open); saving it then makes a .bmpf and leaves the .bmpt as it was.
- Routing 1 (BMPFast 2’s report, as Open in browser on its Report tab gives it)
- Routing 1 — Summary Report (BMPFast 2’s report, as Open in browser on its Report tab gives it)
- Retention (BMPFast 2’s report, as Open in browser on its Report tab gives it)
- Retention — calculations (BMPFast 2’s report, as Open in browser on its Report tab gives it)
- Retention Efficiency Tables (BMPFast 2’s report, as Open in browser on its Report tab gives it)
6Help and methodology
Calculated with BMPFast 2 version 2.0.0 (2026-10-20), which opens the problem’s v1 project as it is. Screen captures are of BMPFast 2’s own window and are for demonstration only.