
All programs › BMPFast › BMPFast 2 sample problems
Routing: wet ponds in series (2020 manual)
BMPFast sample project: three catchments, each with a wet pond, routed in series.
Help: Routing (help page 220) · Download the .bmpf · Link to Solution in BMPFast Version 1
1The problem
The BMPFast sample project Detention in series, 2020 TAC manual page 194: three catchments in Zone 4, each with its own wet detention pond, drain one into the next. In this copy only the upstream pond has a littoral zone, as the credit counts once in a series.
| Input | Value | Source |
|---|---|---|
| Project (General Site Information) | ||
| Meteorological zone | Florida Zone 4 | Zone map (help page 815) |
| Mean annual rainfall | 52 in | Mean annual rainfall map (help page 815) |
| Performance standard (analysis type) | All sites non-exempted | BMPFast sample project |
| Catchment 1: upstream one (Watershed Characteristics) | ||
| Land use, pre / post | Agricultural - Citrus / User Defined Values | BMPFast sample project |
| Area, pre / post | 20.75 / 20.75 ac | BMPFast sample project |
| Non-DCIA curve number, pre / post | 68.3 / 76.12 | BMPFast sample project |
| DCIA, pre / post | 0 / 17.9 % | BMPFast sample project |
| EMC TN, pre / post | 2.110 / 1.816 mg/L | BMPFast land use table (AH Vol I Table 9.2) |
| EMC TP, pre / post | 0.180 / 0.453 mg/L | BMPFast land use table (AH Vol I Table 9.2) |
| Wet pond area (no loading) | 0.79 ac | BMPFast sample project |
| BMP used in routing | Wet Detention: permanent pool 1 ac-ft; There is a littoral zone ticked; MAPs credit 0 % | BMPFast sample project |
| Routes to | Catchment 2 | BMPFast sample project |
| Catchment 2: Catchment 2 (Watershed Characteristics) | ||
| Land use, pre / post | Agricultural - Citrus / User Defined Values | BMPFast sample project |
| Area, pre / post | 25.13 / 25.13 ac | BMPFast sample project |
| Non-DCIA curve number, pre / post | 68.3 / 76.12 | BMPFast sample project |
| DCIA, pre / post | 0 / 17.8 % | BMPFast sample project |
| EMC TN, pre / post | 2.110 / 1.715 mg/L | BMPFast land use table (AH Vol I Table 9.2) |
| EMC TP, pre / post | 0.180 / 0.407 mg/L | BMPFast land use table (AH Vol I Table 9.2) |
| Wet pond area (no loading) | 1.55 ac | BMPFast sample project |
| BMP used in routing | Wet Detention: permanent pool 1.25 ac-ft; There is a littoral zone unticked; MAPs credit 0 % | BMPFast sample project |
| Routes to | Catchment 3 | BMPFast sample project |
| Catchment 3: Catchment 0 (Watershed Characteristics) | ||
| Land use, pre / post | Agricultural - Citrus / User Defined Values | BMPFast sample project |
| Area, pre / post | 37.41 / 37.41 ac | BMPFast sample project |
| Non-DCIA curve number, pre / post | 68.3 / 84 | BMPFast sample project |
| DCIA, pre / post | 0 / 19 % | BMPFast sample project |
| EMC TN, pre / post | 2.110 / 1.816 mg/L | BMPFast land use table (AH Vol I Table 9.2) |
| EMC TP, pre / post | 0.180 / 0.453 mg/L | BMPFast land use table (AH Vol I Table 9.2) |
| Wet pond area (no loading) | 1.70 ac | BMPFast sample project |
| BMP used in routing | Wet Detention: permanent pool 2.5 ac-ft; There is a littoral zone unticked; MAPs credit 0 % | BMPFast sample project |
| Routes to | the Outlet | BMPFast sample project |
Find: the loads leaving the site when the catchments are routed through each other, and how BMPFast treats the chain.
2Steps in BMPFast 2
Start BMPFast 2 and choose File ▸ New project. The tree on the left opens on the project (General Site Information). On its Entry tab enter: Project name Detention in series 2020 TAC manual page 194; Meteorological zone Florida Zone 4; Mean annual rainfall 52.00 in; Type of analysis All sites non-exempted. (To follow along with the finished project instead, choose File ▸ Open and open
routing-detention-in-series.bmpffrom Files below.)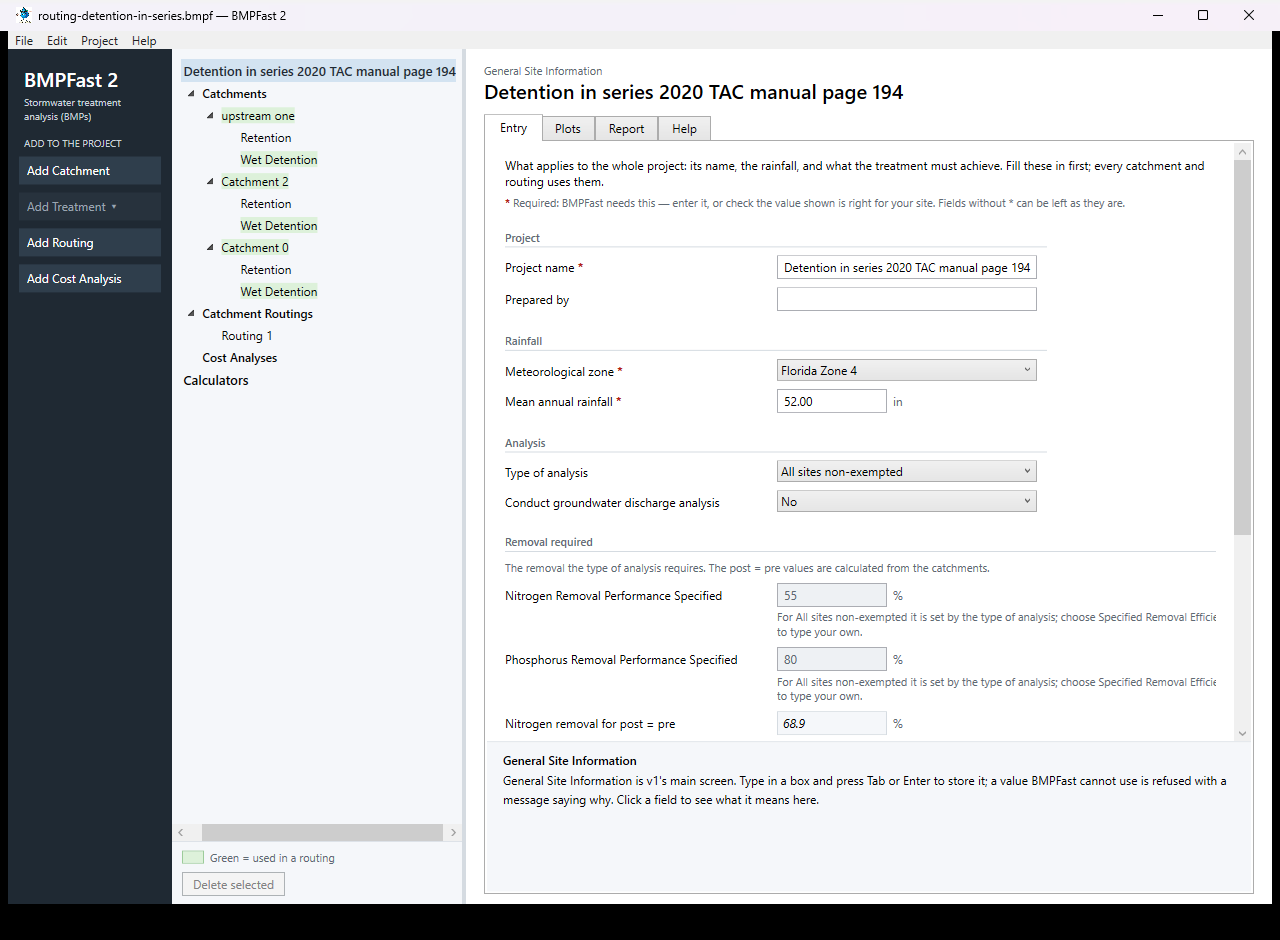
General Site Information: the project’s Entry tab. Press Add Catchment (left). Select the new catchment in the tree; on its Entry tab type the name upstream one and enter: Land use (pre) Agricultural - Citrus; Land use (post) User Defined Values; Area (pre) 20.75 ac; Area (post) 20.75 ac; Non-DCIA curve number (pre) 68.30; Non-DCIA curve number (post) 76.12; DCIA (post) 17.90 %; Nitrogen EMC (post) 1.816 mg/L; Phosphorus EMC (post) 0.453 mg/L; Wet pond area (no loading from this area) 0.79 ac. Leave the other boxes as they are (0 or blank). BMPFast 2 calculates as you type; scroll down to Calculated for the results after development: Annual runoff coefficient (ROC) (post) 0.232; Runoff volume (post) 20.077 ac-ft/yr; Nitrogen load (post) 44.954 kg/yr; Phosphorus load (post) 11.214 kg/yr.
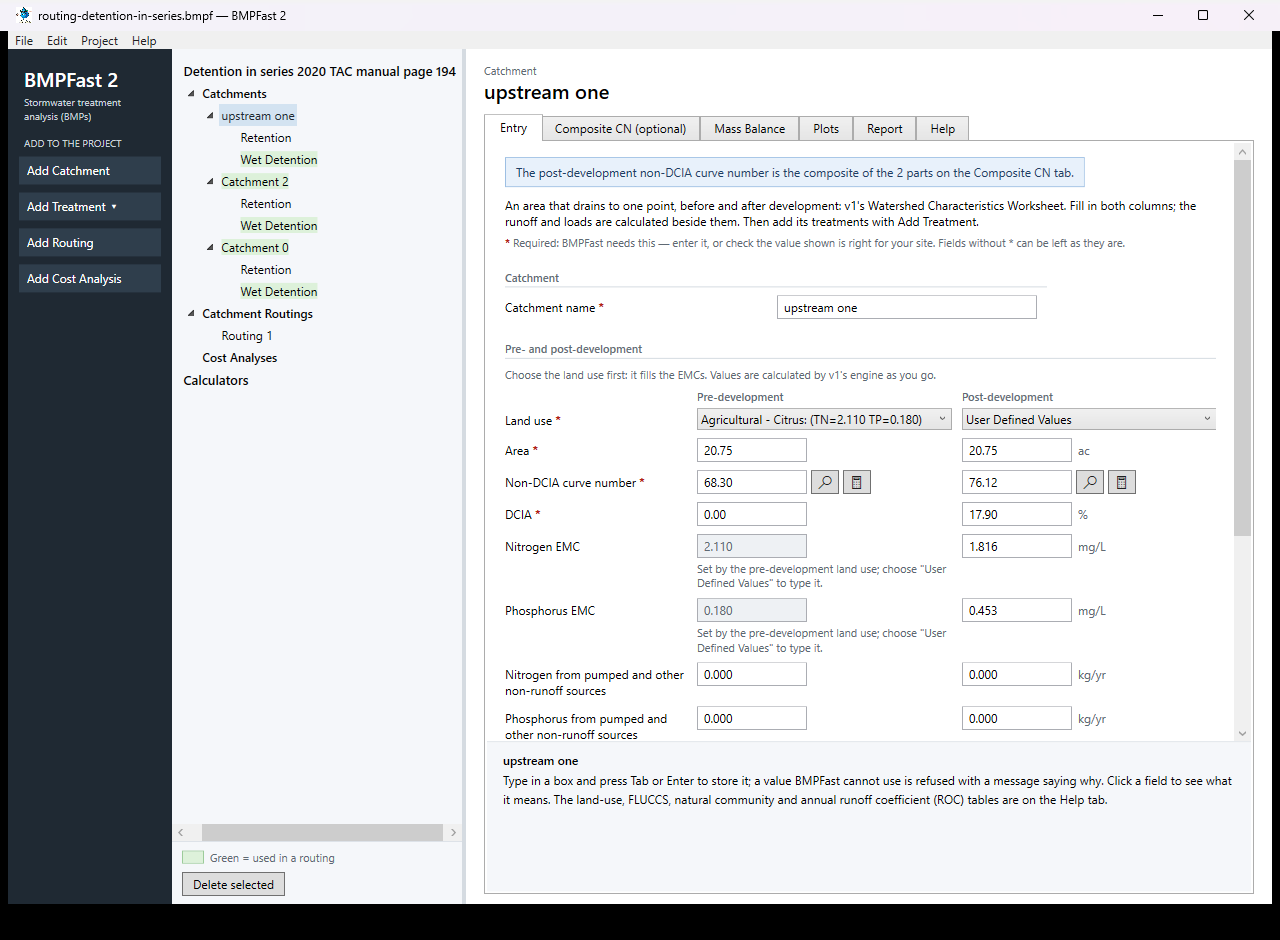
The catchment upstream one: its Entry tab. With upstream one selected, press Add Treatment and choose Wet Detention. On its Entry tab type the Treatment name Wet Detention (BMPFast 2 starts it as “Wet Detention 1”) and enter: Permanent pool volume 1.000 ac-ft; How the littoral zone counts Littoral zone credit (BMPFast 2); There is a littoral zone Yes; Littoral zone credit 10.0 %. The results are calculated as you type: Average residence time 18.18 days; Permanent pool volume for 31 days residence 1.71 ac-ft; Nitrogen removal provided 45.26 %; Phosphorus removal provided 70.40 %.
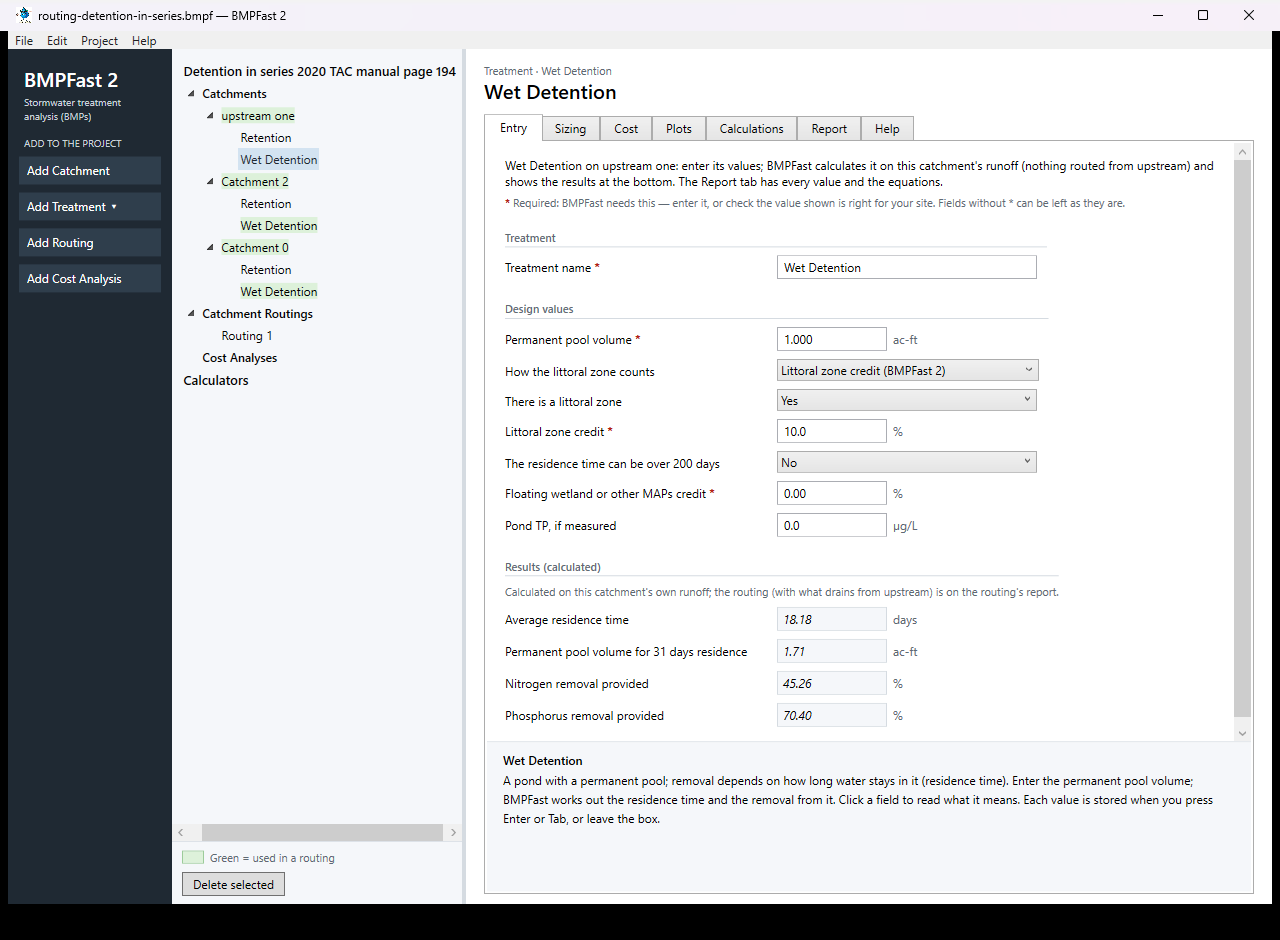
The treatment Wet Detention: its Entry tab. Open the treatment’s Report tab: its inputs and removal in this catchment, as a report to print or save.
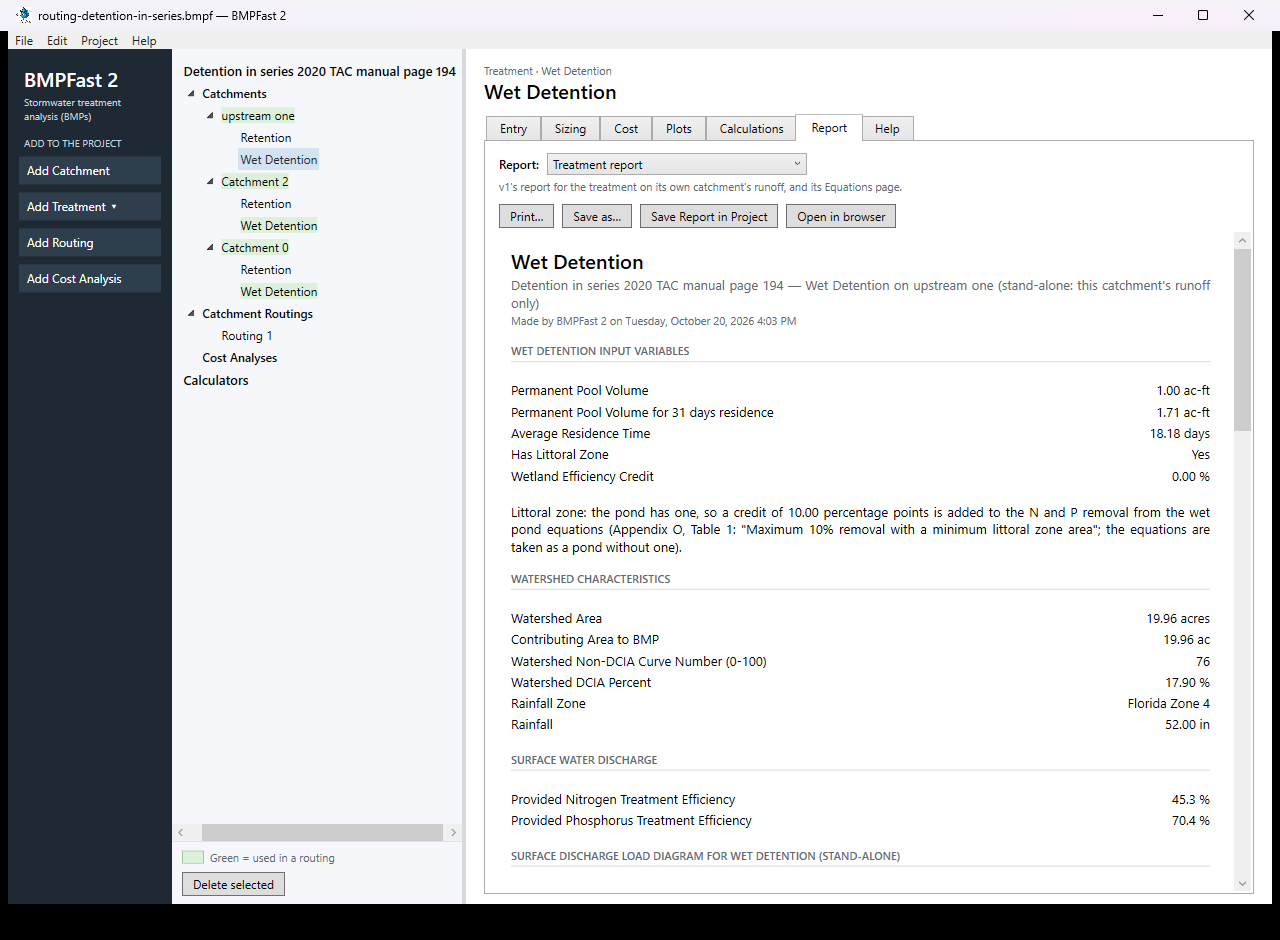
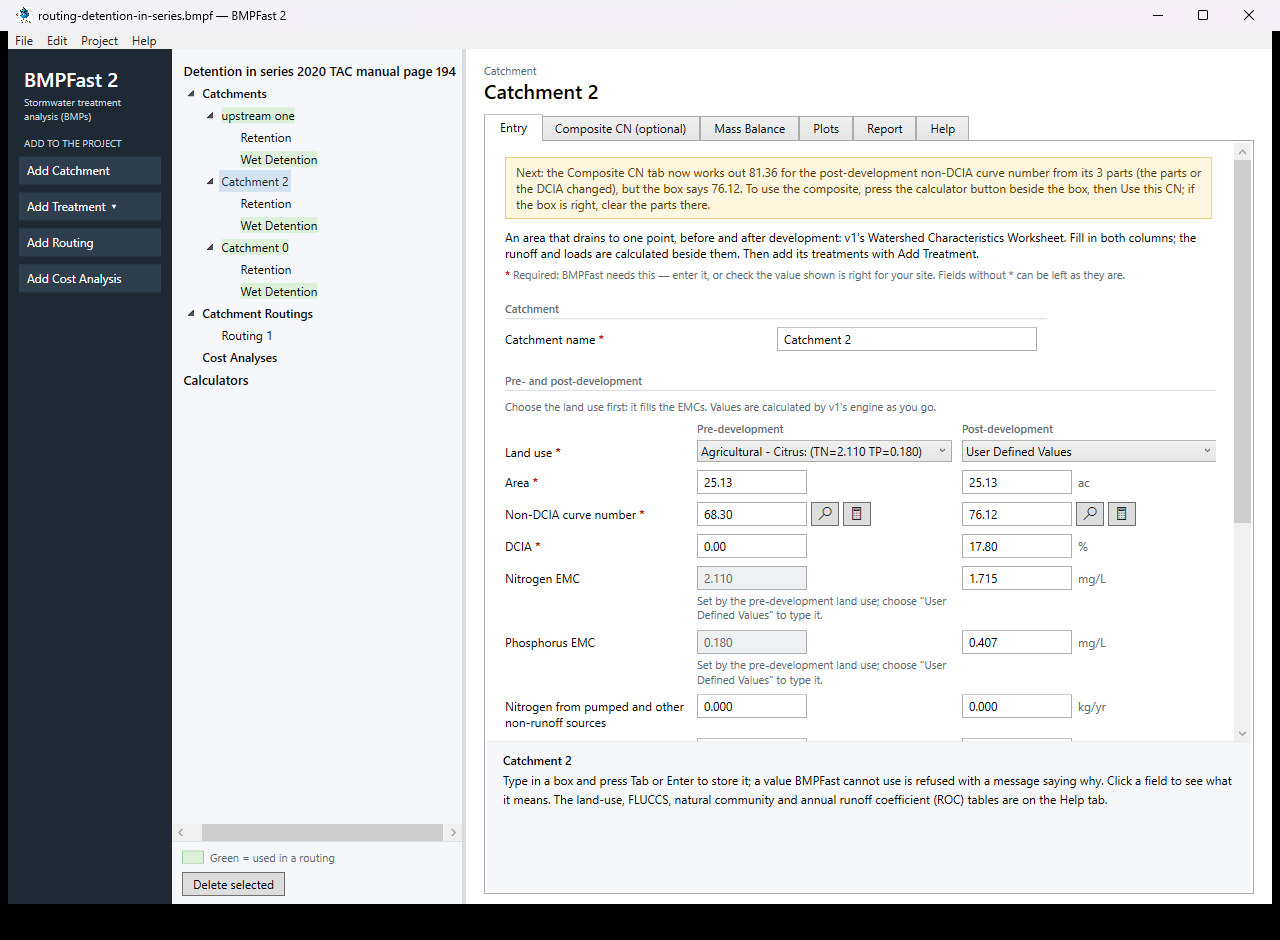
The treatment Wet Detention: its Report tab. Press Add Catchment (left). Select the new catchment in the tree; on its Entry tab type the name Catchment 2 and enter: Land use (pre) Agricultural - Citrus; Land use (post) User Defined Values; Area (pre) 25.13 ac; Area (post) 25.13 ac; Non-DCIA curve number (pre) 68.30; Non-DCIA curve number (post) 76.12; DCIA (post) 17.80 %; Nitrogen EMC (post) 1.715 mg/L; Phosphorus EMC (post) 0.407 mg/L; Wet pond area (no loading from this area) 1.55 ac. Leave the other boxes as they are (0 or blank). BMPFast 2 calculates as you type; scroll down to Calculated for the results after development: Annual runoff coefficient (ROC) (post) 0.231; Runoff volume (post) 23.645 ac-ft/yr; Nitrogen load (post) 50.000 kg/yr; Phosphorus load (post) 11.866 kg/yr.
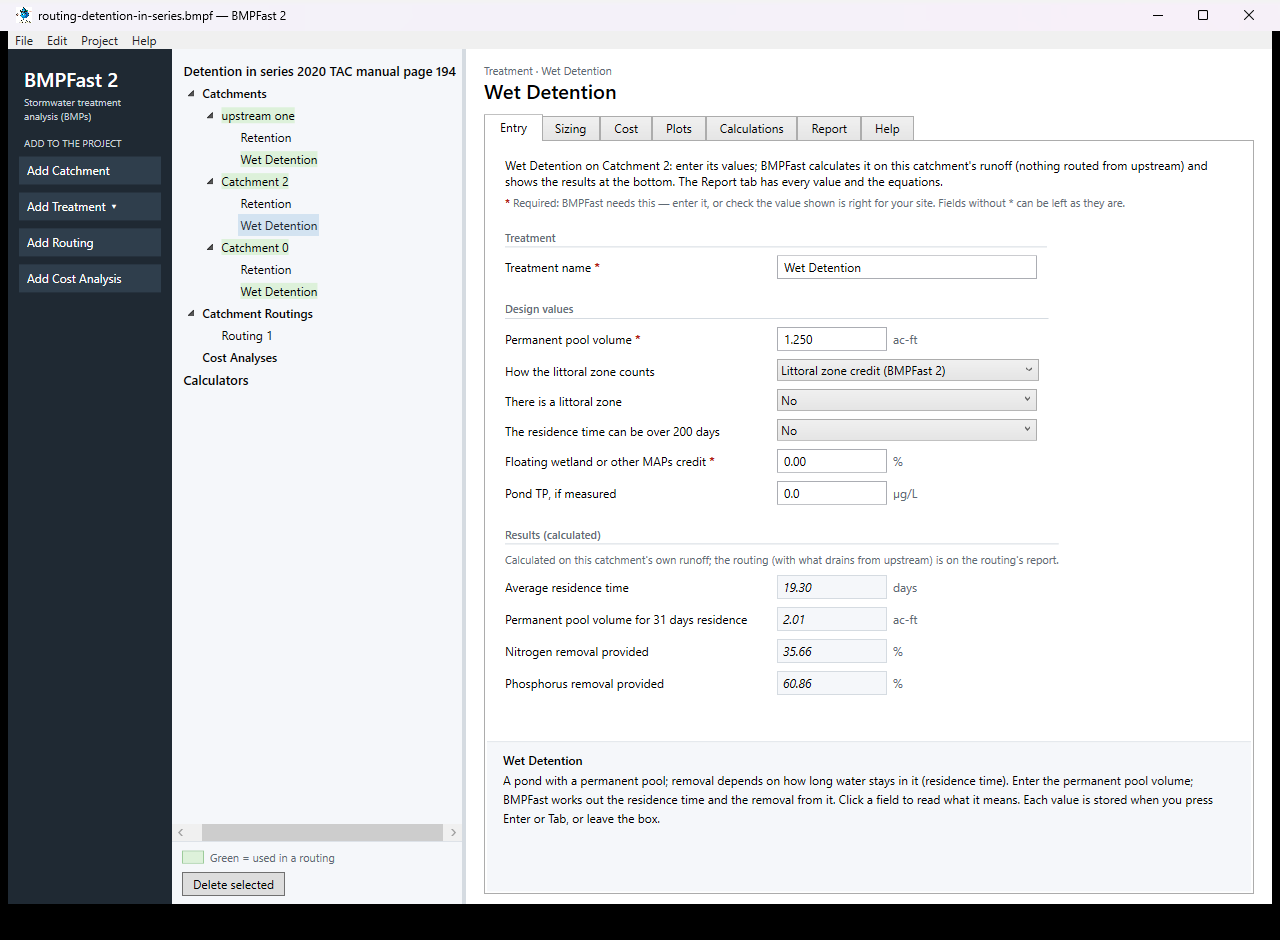
The catchment Catchment 2: its Entry tab. With Catchment 2 selected, press Add Treatment and choose Wet Detention. On its Entry tab type the Treatment name Wet Detention (BMPFast 2 starts it as “Wet Detention 1”) and enter: Permanent pool volume 1.250 ac-ft; How the littoral zone counts Littoral zone credit (BMPFast 2). The results are calculated as you type: Average residence time 19.30 days; Permanent pool volume for 31 days residence 2.01 ac-ft; Nitrogen removal provided 35.66 %; Phosphorus removal provided 60.86 %. These are the treatment alone, on its own catchment’s runoff; the routing calculates it again with the water that drains to it from upstream, so the routing’s numbers below differ.
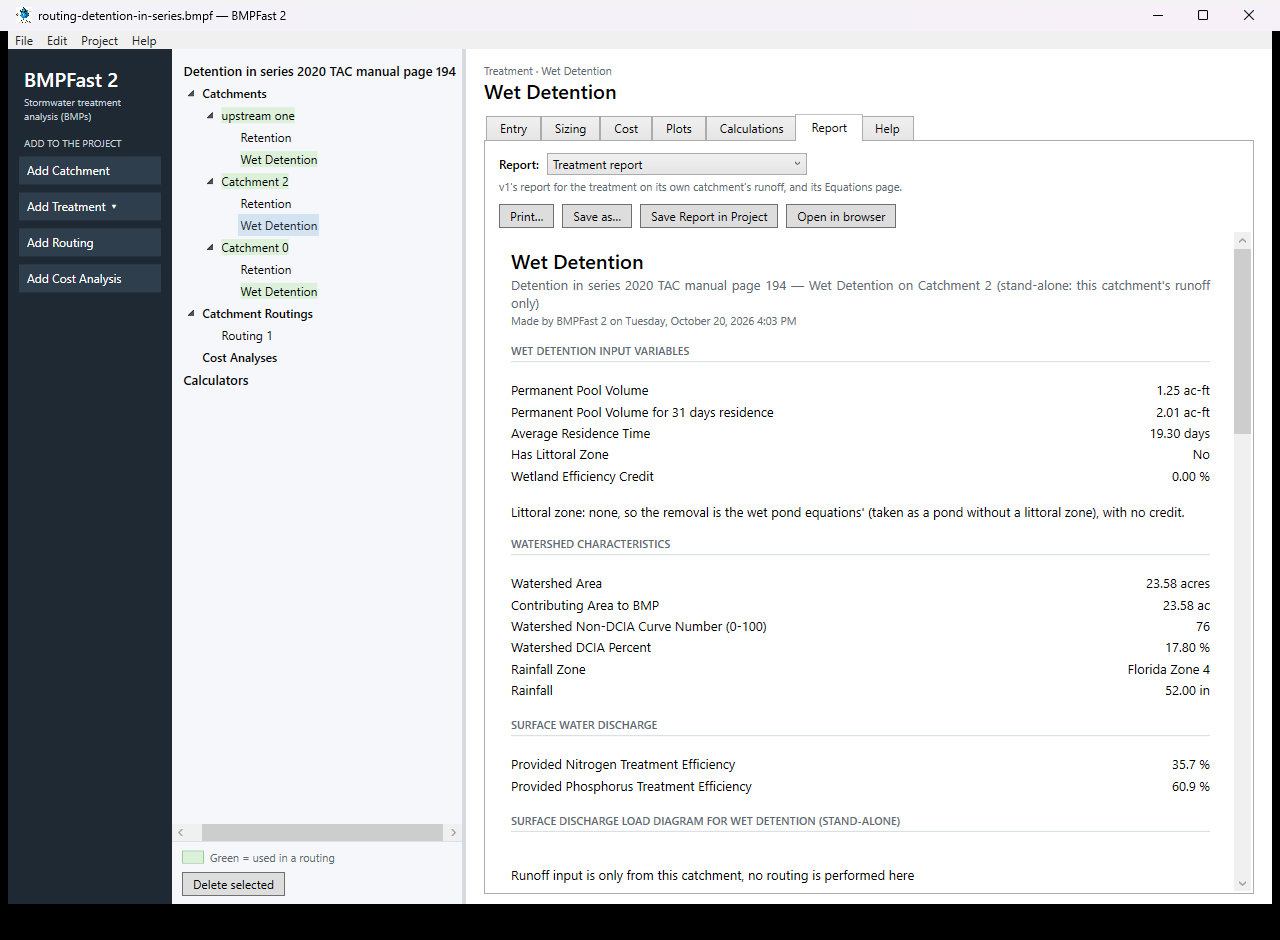
The treatment Wet Detention: its Entry tab. Open the treatment’s Report tab: its inputs and removal in this catchment, as a report to print or save.
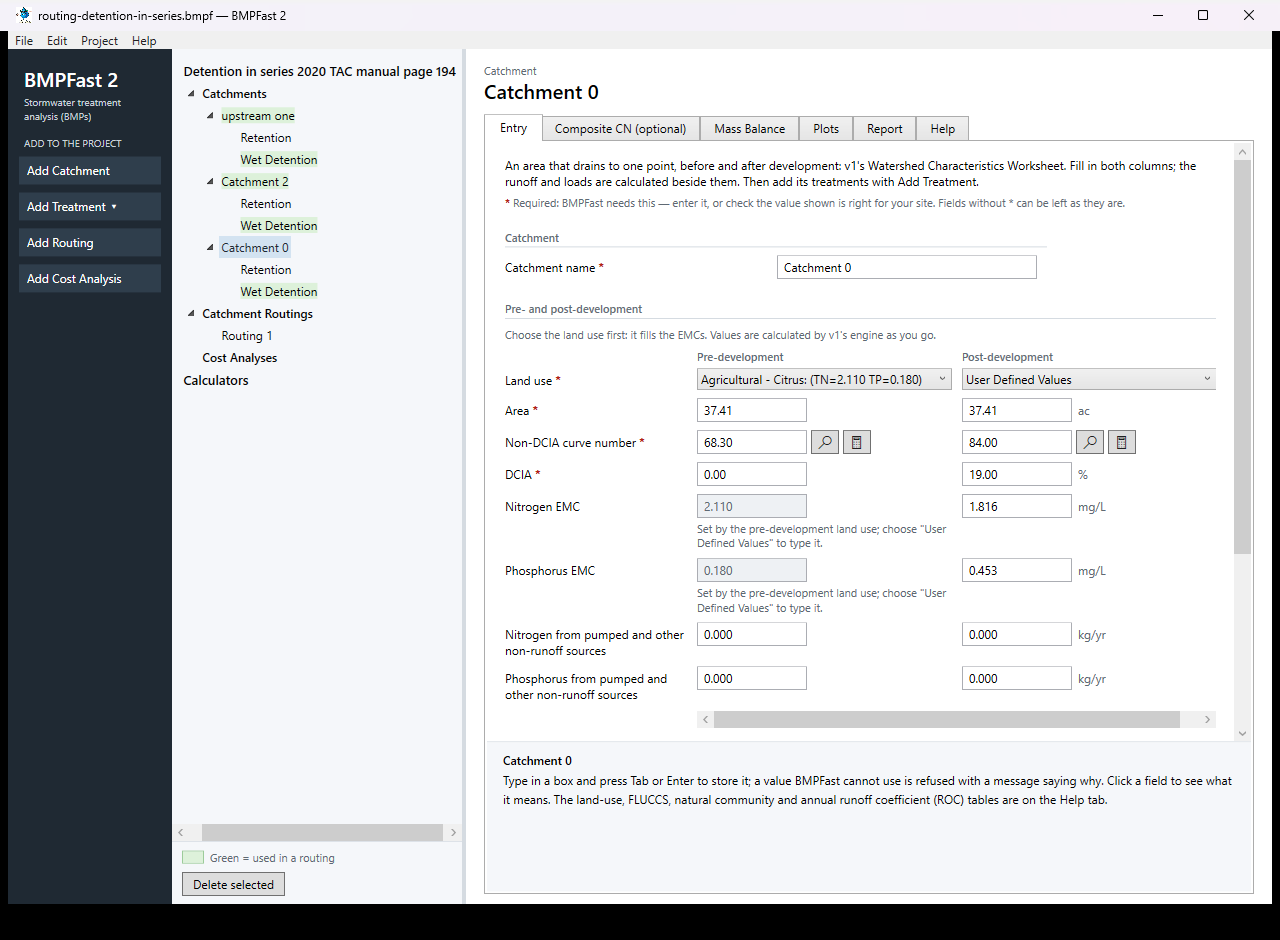
The treatment Wet Detention: its Report tab. Press Add Catchment (left). Select the new catchment in the tree; on its Entry tab type the name Catchment 0 and enter: Land use (pre) Agricultural - Citrus; Land use (post) User Defined Values; Area (pre) 37.41 ac; Area (post) 37.41 ac; Non-DCIA curve number (pre) 68.30; Non-DCIA curve number (post) 84.00; DCIA (post) 19.00 %; Nitrogen EMC (post) 1.816 mg/L; Phosphorus EMC (post) 0.453 mg/L; Wet pond area (no loading from this area) 1.70 ac. Leave the other boxes as they are (0 or blank). BMPFast 2 calculates as you type; scroll down to Calculated for the results after development: Annual runoff coefficient (ROC) (post) 0.295; Runoff volume (post) 45.668 ac-ft/yr; Nitrogen load (post) 102.256 kg/yr; Phosphorus load (post) 25.508 kg/yr.
The catchment Catchment 0: its Entry tab. With Catchment 0 selected, press Add Treatment and choose Wet Detention. On its Entry tab type the Treatment name Wet Detention (BMPFast 2 starts it as “Wet Detention 1”) and enter: Permanent pool volume 2.500 ac-ft; How the littoral zone counts Littoral zone credit (BMPFast 2). The results are calculated as you type: Average residence time 19.98 days; Permanent pool volume for 31 days residence 3.88 ac-ft; Nitrogen removal provided 35.88 %; Phosphorus removal provided 61.12 %. These are the treatment alone, on its own catchment’s runoff; the routing calculates it again with the water that drains to it from upstream, so the routing’s numbers below differ.
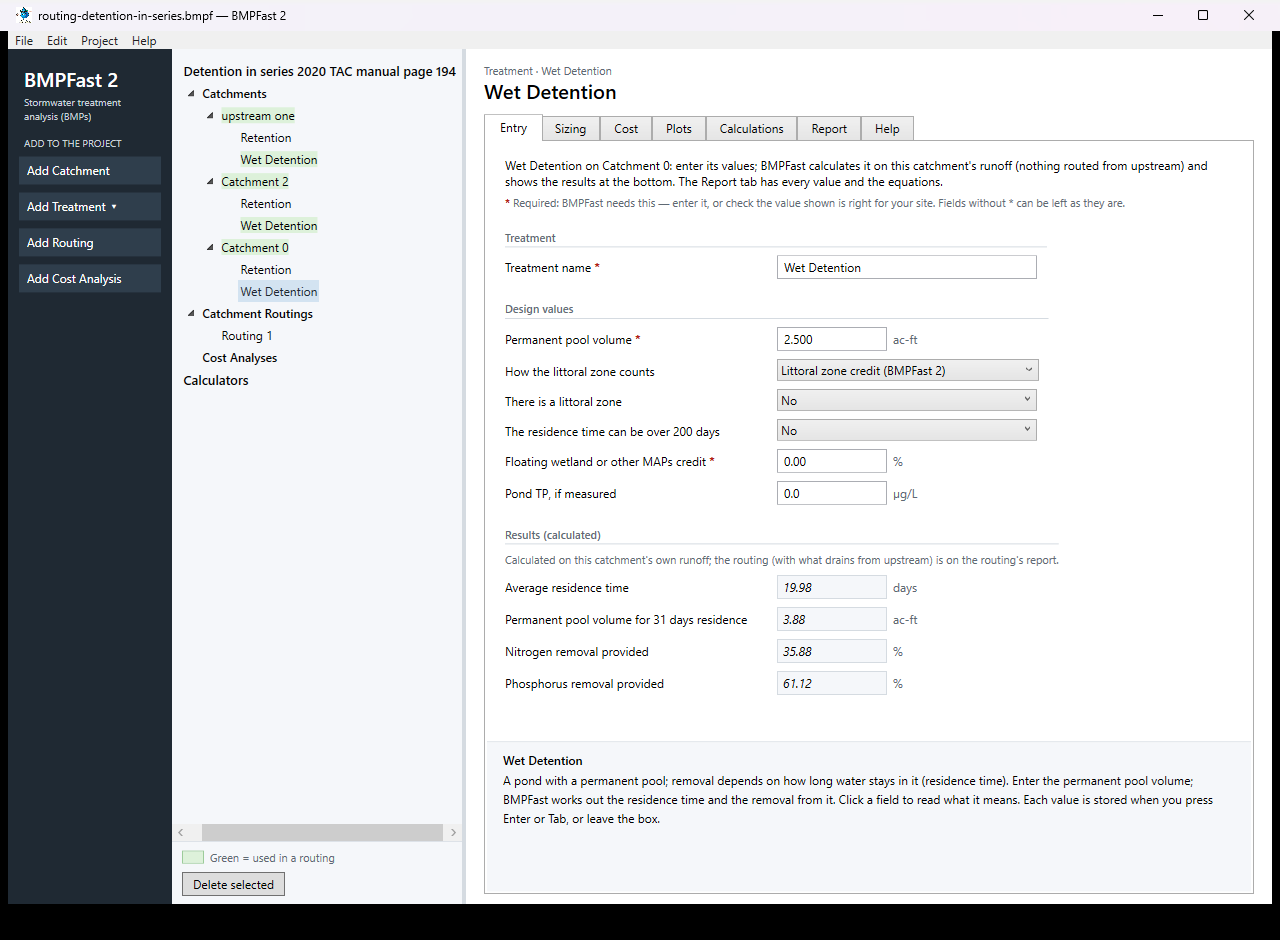
The treatment Wet Detention: its Entry tab. Open the treatment’s Report tab: its inputs and removal in this catchment, as a report to print or save.
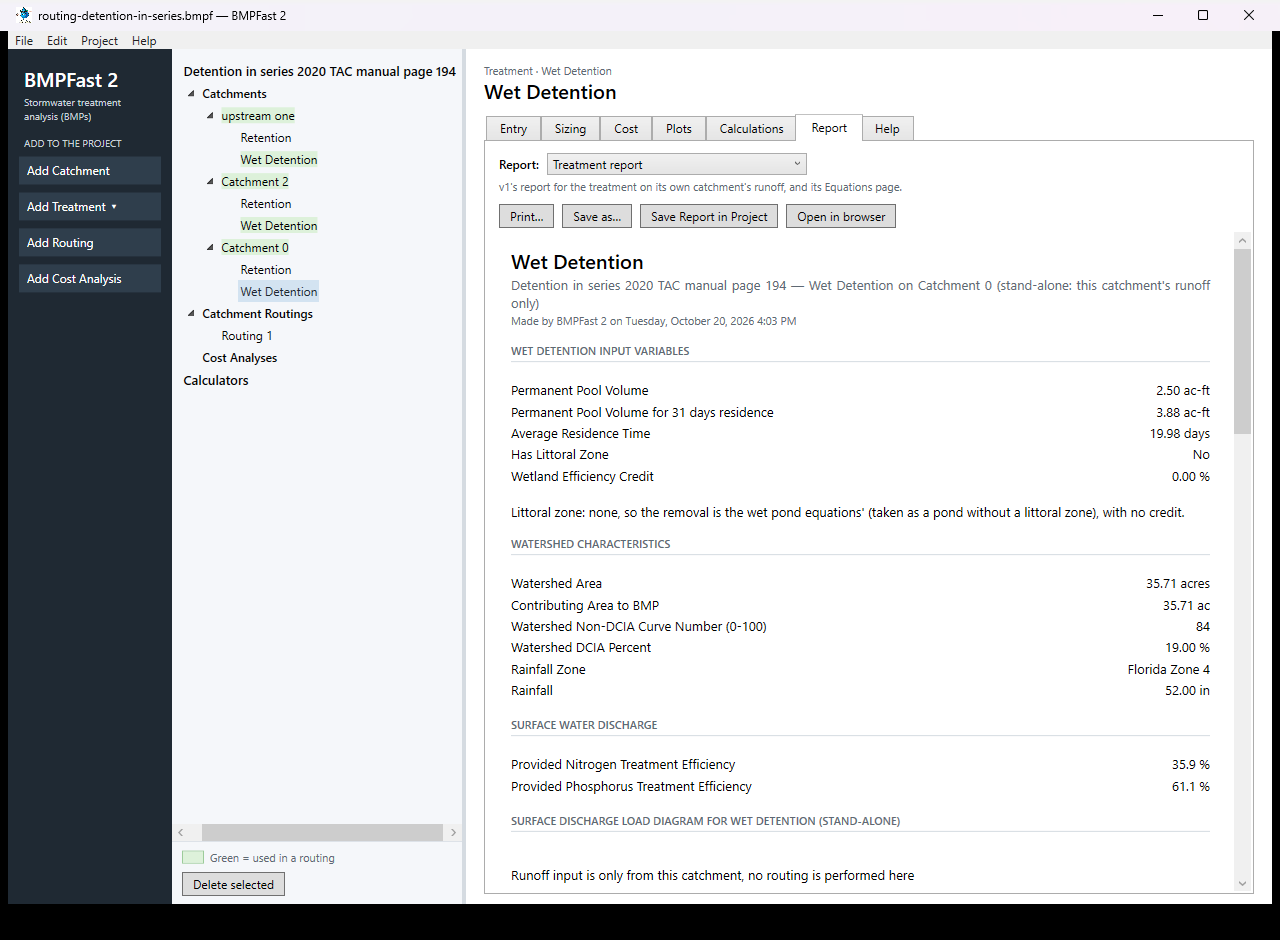
The treatment Wet Detention: its Report tab. Press Add Routing (left). BMPFast 2 adds Routing 1 under Catchment Routings, with every catchment draining to the outlet and no treatment; a project can have several routings, compared side by side. On its Entry tab (How the routing is calculated Strand routing (v1's routing; use this for permits)) set each catchment as in this table:
Catchment Drains to Treatment used Runoff from upstream catchments upstream one Catchment 2 Wet Detention Catchment 2 Catchment 0 Wet Detention Treated with this catchment's own runoff Catchment 0 Outlet Wet Detention Treated with this catchment's own runoff A catchment is treated only by the treatment its routing uses.
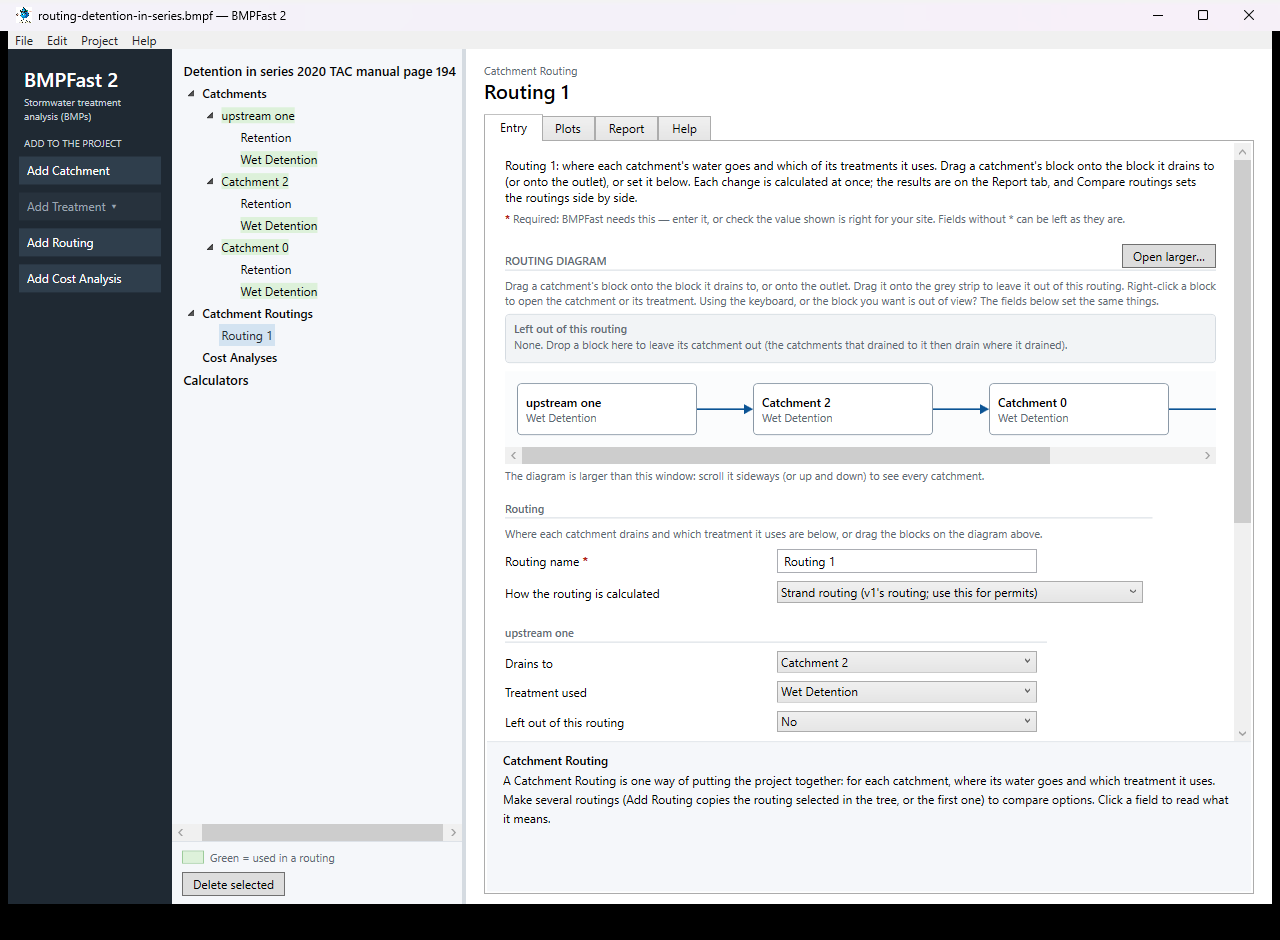
The routing’s Entry tab: where each catchment drains and the treatment it uses. Open the routing’s Report tab. Results shows the loads leaving the site, the removal provided and required, and whether the performance standard is met; the list at the top of the tab has v1’s reports for the same routing (Summary, Complete, Flow Balance, AH Vol I Sec 9 compliance). Save the project with File ▸ Save; compare it with the .bmpf under Files.
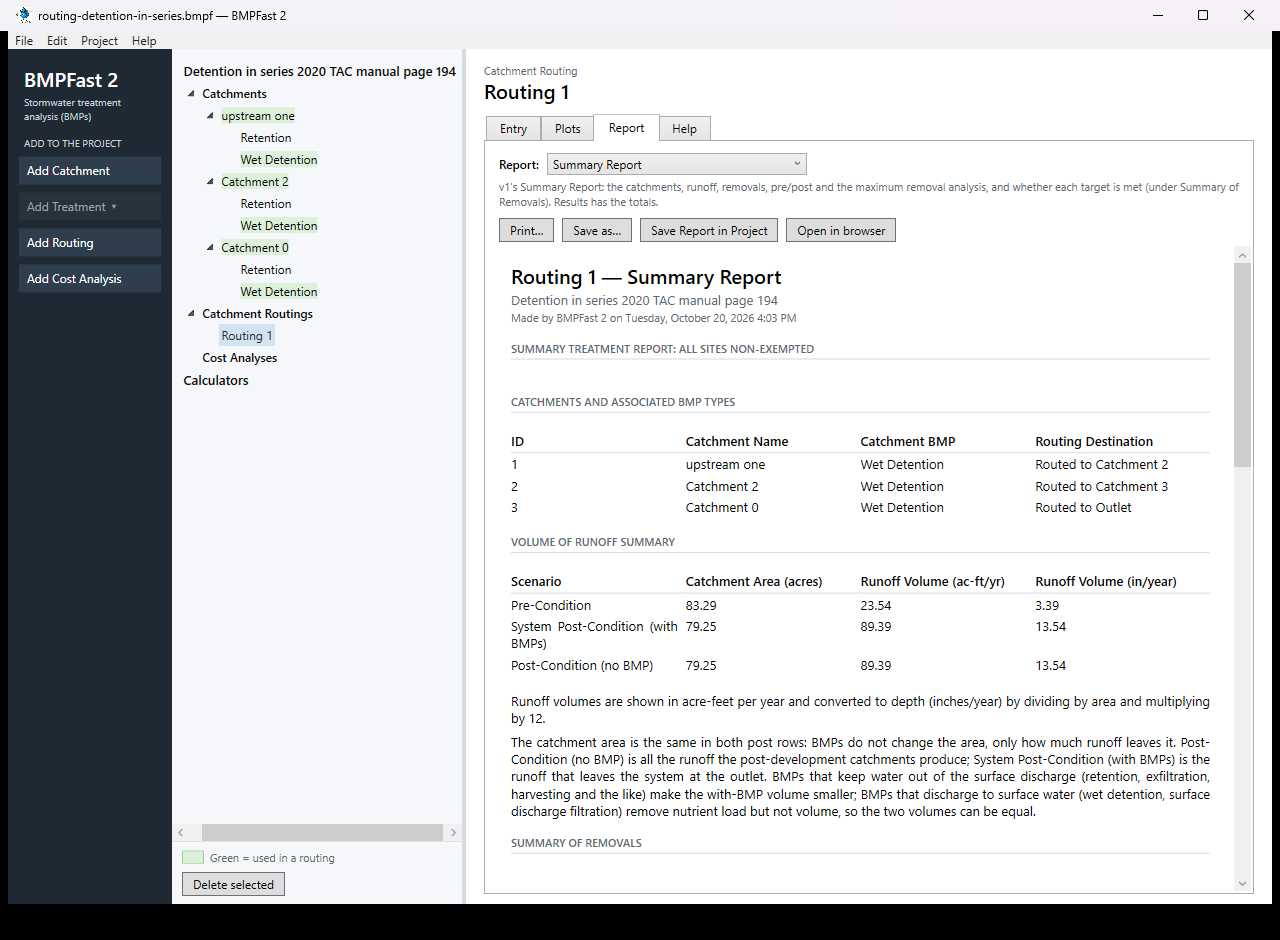
The routing’s Report tab: Results.
3Results
| Catchment | Runoff (ac-ft/yr) | TN load (kg/yr) | TP load (kg/yr) | BMP → routes to |
|---|---|---|---|---|
| 1. upstream one | 20.077 | 44.954 | 11.214 | Wet Detention → Catchment 2 |
| 2. Catchment 2 | 23.645 | 50.000 | 11.866 | Wet Detention → Catchment 3 |
| 3. Catchment 0 | 45.668 | 102.256 | 25.508 | Wet Detention → the Outlet |
| Result | Value |
|---|---|
| Site (all catchments, at the outlet) | |
| TN load: catchments → outlet | 197.210 → 106.766 kg/yr |
| TP load: catchments → outlet | 48.587 → 14.120 kg/yr |
| Provided removal TN / TP | 45.9 % / 70.9 % |
| Required removal TN / TP (Maximum % Removal) | 68.9 % (not met) / 89.2 % (not met) |
Strands found by BMPFast (a strand is a run of catchments in series that BMPFast may calculate as one system):
- Catchments 1 → 2 → 3 form one strand, “All Catchments are Detention in Series”: BMPFast calculates them as one system (TN in 197.210 kg/yr, removal 41.43 %, out 115.496 kg/yr).
The Full Routing Diagram report
Open this report on its own page.
The Summary Report
Open this report on its own page.
BMPFast 2 and BMPFast (v1)
| Result | BMPFast 2 | BMPFast (v1), its page | |
|---|---|---|---|
| Nitrogen leaving the site | 106.766 kg/yr | 115.496 kg/yr | differs |
| Phosphorus leaving the site | 14.120 kg/yr | 16.621 kg/yr | differs |
| Site removal, nitrogen | 45.861 % | 41.435 % | differs |
| Site removal, phosphorus | 70.939 % | 65.792 % | differs |
| upstream one: Wet Detention removal, nitrogen | 45.256 % | 35.256 % | differs |
| upstream one: Wet Detention removal, phosphorus | 70.403 % | 60.403 % | differs |
| Catchment 2: Wet Detention removal, nitrogen | 30.816 % | 27.734 % | differs |
| Catchment 2: Wet Detention removal, phosphorus | 56.245 % | 50.621 % | differs |
| Catchment 0: Wet Detention removal, nitrogen | 30.614 % | 27.553 % | differs |
| Catchment 0: Wet Detention removal, phosphorus | 56.083 % | 50.475 % | differs |
BMPFast 2 gives a different number for: Nitrogen leaving the site, Phosphorus leaving the site, Site removal, nitrogen, Site removal, phosphorus, upstream one: Wet Detention removal, nitrogen, upstream one: Wet Detention removal, phosphorus, Catchment 2: Wet Detention removal, nitrogen, Catchment 2: Wet Detention removal, phosphorus, Catchment 0: Wet Detention removal, nitrogen, Catchment 0: Wet Detention removal, phosphorus. See the notes below the table.
When BMPFast 2 opened the v1 file it said:
- upstream one, Wet Detention: BMPFast 2 takes the wet pond equations as a pond without a littoral zone, and adds a littoral zone credit of 10 percentage points (Appendix O's maximum) to this pond's removal, so it is higher than v1 shows; lower Littoral zone credit if your permit reviewer allows less. To calculate as v1, choose "Reduce without a littoral zone (v1)" in How the littoral zone counts (Design values) on the treatment's Entry tab.
- Catchment 2, Wet Detention: BMPFast 2 takes the wet pond equations as a pond without a littoral zone, and this pond has none, so its removal is not multiplied by 0.90 as v1 does: it is higher than v1 shows. To calculate as v1, choose "Reduce without a littoral zone (v1)" in How the littoral zone counts (Design values) on the treatment's Entry tab.
- Catchment 0, Wet Detention: BMPFast 2 takes the wet pond equations as a pond without a littoral zone, and this pond has none, so its removal is not multiplied by 0.90 as v1 does: it is higher than v1 shows. To calculate as v1, choose "Reduce without a littoral zone (v1)" in How the littoral zone counts (Design values) on the treatment's Entry tab.
4Check
Loads.
Each catchment’s load is EMC × runoff × 1.233 (Equation 9-2). Together:
| TN 44.954 + 50.000 + 102.256 | = 197.210 kg/yr (program 197.210) |
TP 48.587 kg/yr (program 48.587).
Wet detention in series (the strand rule).
BMPFast finds the strand “All Catchments are Detention in Series” and calculates the ponds as one system: the permanent pools (4.75 ac-ft in all) and the runoff of the chain give one residence time, then the Appendix O pond equations give the system removal, TN 41.43 % and TP 65.79 %.
| TN out | = 197.210 × (1 − 41.43 / 100) |
| = 115.496 kg/yr (program 115.496). |
Only the upstream pond (Catchment 1) has its littoral zone box ticked: in a series of wet ponds the littoral zone credit counts once, on the most upstream pond (Ron Eaglin, October 19, 2026); ponds in parallel may each keep it. See Strand Based Routing for Wet Detention in Series and the comparison of methods for ponds in series.
The standard is not met, and that is expected. “All sites non-exempted” requires the greater of 55 % TN and 80 % TP, or the removal that keeps the post-development load at the pre-development load (Equation 9-3) (AH Vol I 8.3.2). The post = pre removal (Equation 9-3, (post load − pre load) / post load) is TN 68.9 % and TP 89.2 %. BMPFast takes the larger of the standard’s percentage and the post = pre removal as the Maximum % Removal, shown on every worksheet’s status bar and in the Summary Report: here TN 68.9 % and TP 89.2 %. This problem shows what this design removes (45.9 % / 70.9 %), which is less. To meet it, add BMPs in series or downstream catchments (see BMPs in Series and Routing), or size the BMP (see Sizing).
5Files
- routing-detention-in-series.bmpf: the project, saved by BMPFast 2. Save it (your browser puts it in Downloads), then in BMPFast 2 choose File ▸ Open and open it. Opened again and calculated, it gives the numbers on this page.
- routing-detention-in-series.bmpt: the same project as BMPFast (v1) saved it. BMPFast 2 opens it too (File ▸ Open); saving it then makes a .bmpf and leaves the .bmpt as it was.
- Routing 1 (BMPFast 2’s report, as Open in browser on its Report tab gives it)
- Routing 1 — Summary Report (BMPFast 2’s report, as Open in browser on its Report tab gives it)
- Routing 1 — Full Routing Diagram (BMPFast 2’s report, as Open in browser on its Report tab gives it)
- Wet Detention (upstream one) (BMPFast 2’s report, as Open in browser on its Report tab gives it)
- Wet Detention — calculations (upstream one) (BMPFast 2’s report, as Open in browser on its Report tab gives it)
- Wet Detention (Catchment 2) (BMPFast 2’s report, as Open in browser on its Report tab gives it)
- Wet Detention — calculations (Catchment 2) (BMPFast 2’s report, as Open in browser on its Report tab gives it)
- Wet Detention (Catchment 0) (BMPFast 2’s report, as Open in browser on its Report tab gives it)
- Wet Detention — calculations (Catchment 0) (BMPFast 2’s report, as Open in browser on its Report tab gives it)
6Help and methodology
- Routing (help page 220)
- Catchment Configurations (help page 196)
- Strand Based Routing for Wet Detention in Series (help page 4823)
- Strand Based Routing for Retention in Series (help page 4824)
- Strand Based Routing for No Treatment to Detention (help page 4833)
- Strand Based Routing for No Treatment to Retention (help page 4834)
- Link to Solution in BMPFast Version 1
- All BMPFast 2 sample problems
Calculated with BMPFast 2 version 2.0.0 (2026-10-20), which opens the problem’s v1 project as it is. Screen captures are of BMPFast 2’s own window and are for demonstration only.