Horton infiltration
Finds a soil's infiltration rate and the depth infiltrated at a given elapsed time from Horton's fo, fc and k, and recovers the rate from that depth by the inversion SMADA's loss engine uses.
What it is for
When rain starts on dry soil, the soil takes water quickly; as it wets, the rate it can take falls toward a steady value. Horton's equation describes that fall with three numbers: an initial rate fo, a final rate fc, and a decay constant k. This calculator answers two questions about a soil described that way: how fast can it infiltrate after a given time, and how much has it taken in by then?
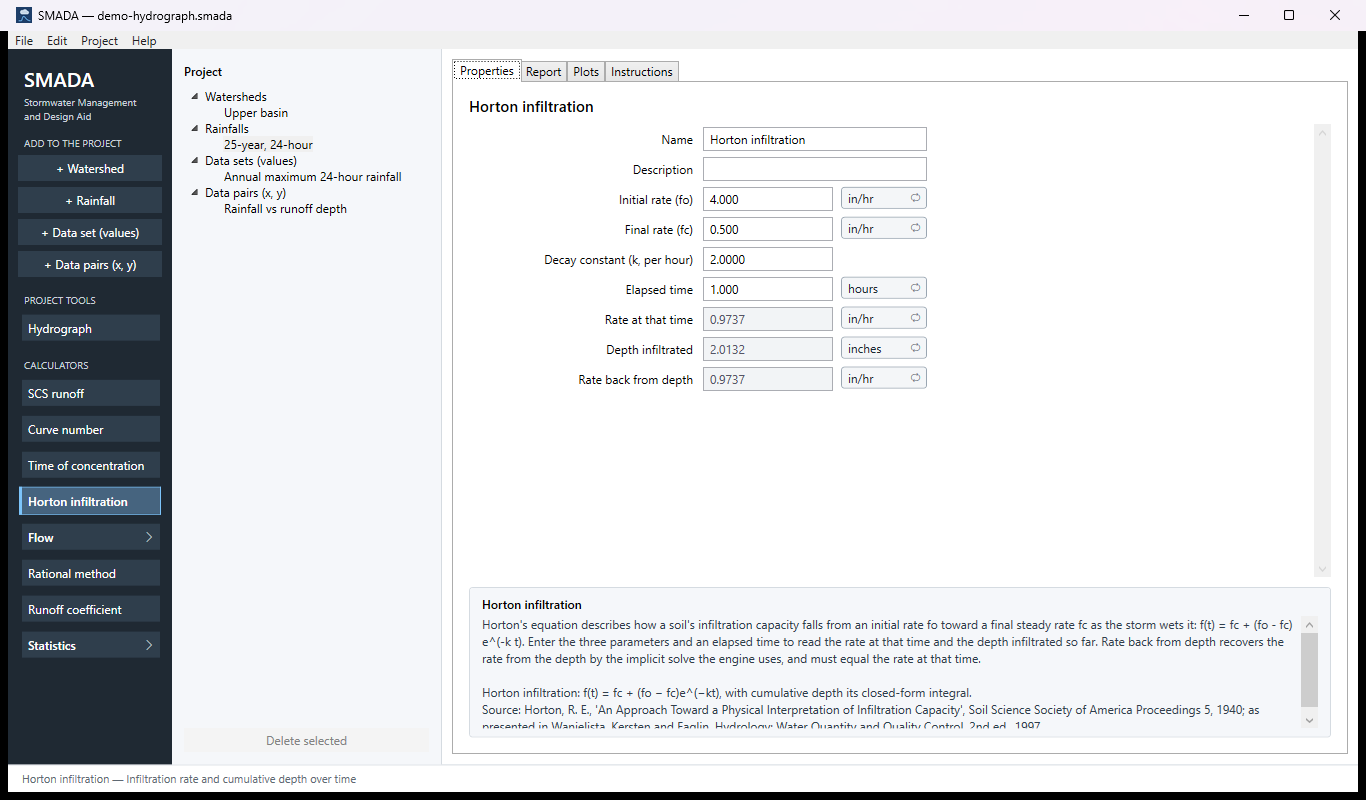
You enter fo and fc in inches per hour (or cm/hr or mm/hr, from the unit label), k per hour, and an elapsed time. You get back the rate at that time, the depth infiltrated from the start to that time, and a third value, the rate recovered from that depth, which must equal the first. If fo is below fc, or k is not above zero, the results show a dash and a note says what to change. It opens with a worked example: fo = 4 in/hr, fc = 0.5 in/hr, k = 2 per hour, read at one hour.
The calculator stands on its own, but it is the same Horton relation a Watershed uses when its loss method is set to Horton. Use it to turn an infiltration test into a depth, to see how quickly a soil reaches its steady rate, or to check what a Horton watershed is taking out of a storm before you run the Hydrograph tool. It gives the soil's capacity, as if water were always available; the watershed's loss method handles rain falling slower than that.
The Horton infiltration tabs
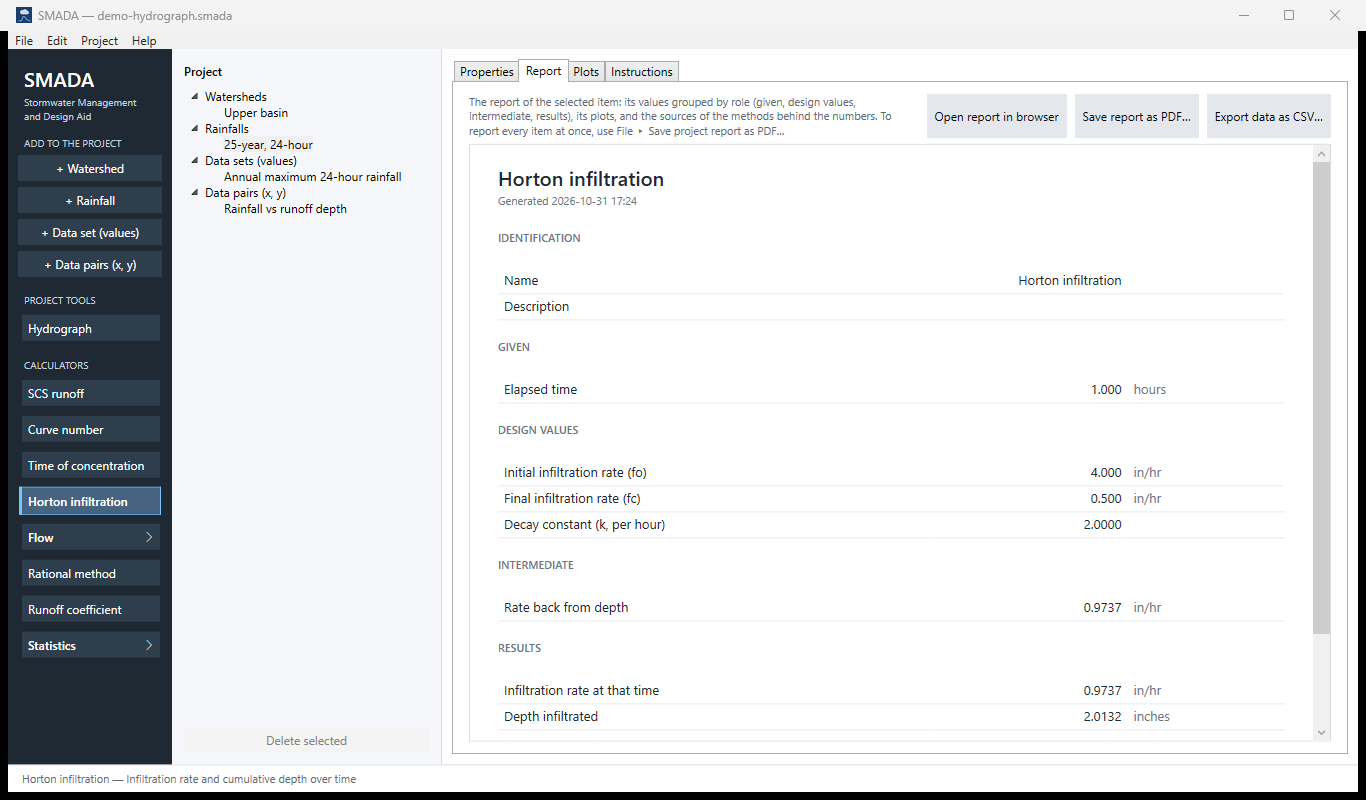
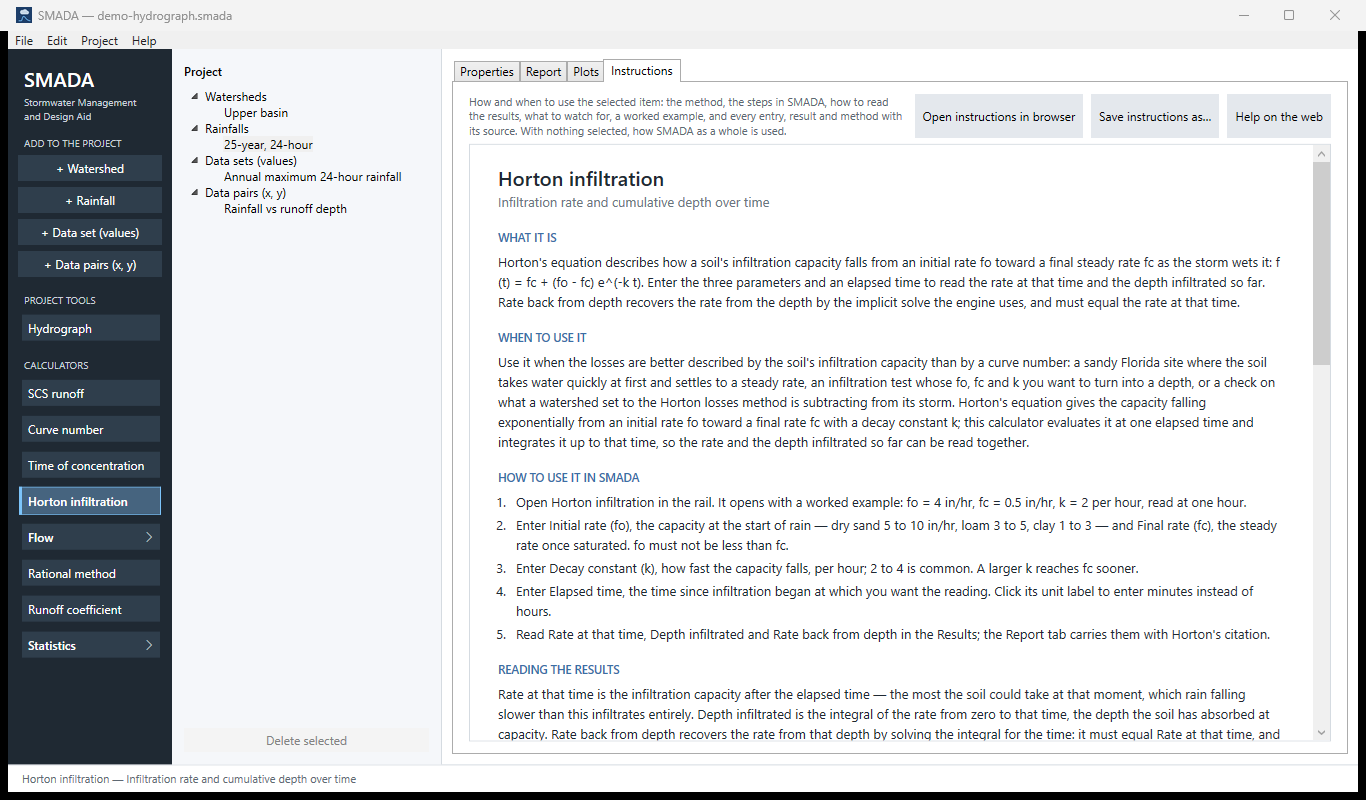
Every item in SMADA has the same four tabs. These are captured from the program with the example values it opens with; select a picture to see it full size.
Horton infiltration has nothing to draw, so its Plots tab is empty and is not shown.
Properties tab — where you enter values and read the results
Report tab — the same values as a report, ready for HTML, PDF or CSV
Instructions tab — the manual page in the program
How it calculates
The calculator evaluates Horton's equation and its integral in closed form at the elapsed time, then solves the integral backwards for the time to recover the rate from the depth. Rates are stored in inches per hour, times in hours, depths in inches; click a unit label to enter or read a rate in cm/hr or mm/hr, a time in minutes, or a depth in centimetres or millimetres. The decay constant k is always per hour.
Check on the inputs
Infiltration capacity decays; it does not grow. If Initial rate (fo) is less than Final rate (fc), or Decay constant (k, per hour) is zero or negative, the three results are left blank, shown as a dash, and a note above the form says: fo must be at least fc, and k greater than 0. A blank entry gives a note asking for all four values. The form also flags any negative entry.
Rate at that time
f(t) = fc + (fo − fc) e−k t
At t ≤ 0 the rate is fo.
- f(t)
- infiltration capacity at time t, in/hr
- fo
- initial rate, in/hr (dry sand 5 to 10, loam 3 to 5, clay 1 to 3)
- fc
- final steady rate, in/hr (sand 0.5 to 1, loam 0.2 to 0.5, clay about 0.05)
- k
- decay constant, 1/hr (2 to 4 is common)
- t
- elapsed time since infiltration began, hr
Depth infiltrated
The integral of the rate from 0 to t:
F(t) = fc t + (fo − fc) (1 − e−k t) / k
At t ≤ 0 the depth is 0.
- F(t)
- depth infiltrated from time 0 to t, at capacity, in
Rate back from depth
In a storm the soil takes only what the rain gives it, so SMADA's Horton loss method has to work from the depth infiltrated, not from clock time. Eliminating t between the two equations above gives the implicit relation
f = fo − fc ln[(f − fc) / (fo − fc)] − k F
SMADA does not iterate on f directly (the logarithm is singular at f = fc). It solves F(t) = F for t and evaluates f(t):
- If F ≤ 0 the rate is fo; if fo = fc the rate is fc.
- Bracket the time: start with [0, 1 hr] and double the upper end until F(t) at the upper end reaches F. If the upper end passes 1012 hr, the rate is taken as fc.
- Bisect: halve the bracket, keeping the half in which F(t) crosses F, until it is narrower than 10−10 hours or 200 halvings have been made.
- The rate is f(t) at the middle of the final bracket.
Because F(t) increases steadily with t, the root is always bracketed and the bisection always converges. This replaced SMADA 10's search, which stepped a trial rate up and down and, if it had not converged after 50 tries, silently returned fc. Showing Rate back from depth beside Rate at that time lets you see the inversion agree.
How a Horton watershed uses this
When a watershed's loss method is Horton, the storm is taken step by step on the part of the watershed that is not directly connected impervious. The capacity over one step is Horton's own integral, starting from the equivalent time t*, the time at which ponded infiltration from the start would have reached the depth already infiltrated F (found by the same bisection):
ΔF = min[ F(t* + Δt) − F(t*), rain available in the step ]
- ΔF
- depth infiltrated in the step, in
- t*
- equivalent time, the root of F(t*) = F, hr
- Δt
- computation step, hr
Under ponding this gives exactly F(t) at any step size, and the soil never takes more than the rain. Until 2026-10-15 SMADA took the rate at the start of the step times Δt, which ignored the decay within the step and infiltrated 9 % too much at a 0.25 h step and 39 % at 0.5 h (fo 3, fc 0.5, k 4 over 2 hours); projects with Horton losses now show less infiltration and more runoff than before. The recovery constant kr is kept in the file but has no effect, since recovery happens between storms and SMADA runs one storm.
Checking the example by hand
With fo = 4 in/hr, fc = 0.5 in/hr, k = 2 per hour and t = 1 hr: e−2 = 0.1353, so f = 0.5 + 3.5 × 0.1353 = 0.9737 in/hr and F = 0.5 × 1 + (3.5 / 2)(1 − 0.1353) = 2.0132 in. The rate back from 2.0132 in is again 0.9737 in/hr. (To six places: f = 0.973673 in/hr and F = 2.013163 in, the values the calculation check of 2026-10-15 holds SMADA to.)
Sources
- Horton, R. E., 'An Approach Toward a Physical Interpretation of Infiltration Capacity', Soil Science Society of America Proceedings 5, 1940; as presented in Wanielista, Kersten and Eaglin, Hydrology: Water Quantity and Quality Control, 2nd ed., 1997.
All SMADA calculators · Get SMADA free for Windows from the Microsoft Store