SMADA
Stormwater Management and Design Aid — free hydrology software for students and engineers that shows its work.
FreeOn the Microsoft StoreVersion 1.1For Windows PCsWorks offline
What it is
SMADA computes the quantities a stormwater design asks for: watershed runoff, time of concentration, design storms and runoff hydrographs. It sizes channels, pipes and weirs, fits frequency distributions to a record of extremes such as annual maximum rainfalls or peak flows, and finds the regression model that fits a set of x, y data.
It shows its work. Every tool names the method it used, the equation behind it and the reference the method comes from, and every tool has a manual page written for someone learning the material. Every calculator also has its own page here, with each of its tabs and a full description of its calculations.
SMADA goes with the textbook Hydrology: Water Quantity and Quality Control (Wanielista, Kersten and Eaglin). This version is rebuilt from the ground up for today’s Windows.

After it installs, open it from the Start menu. To begin, add a watershed and a rainfall with the buttons on the left, then choose Hydrograph to see the runoff. Each tool’s Instructions tab explains what to enter and what you get back.
Help
How to use SMADA: a first worked example from start to finish, the window and its tabs, projects and files, working with the calculators, reports and plots, the Help menu, About and new versions, and what SMADA's messages mean.
Every calculator
Each calculator has its own page: what it is for, a picture of each of its tabs, and a full description of the calculations, with every equation SMADA uses and where it comes from.
Project items
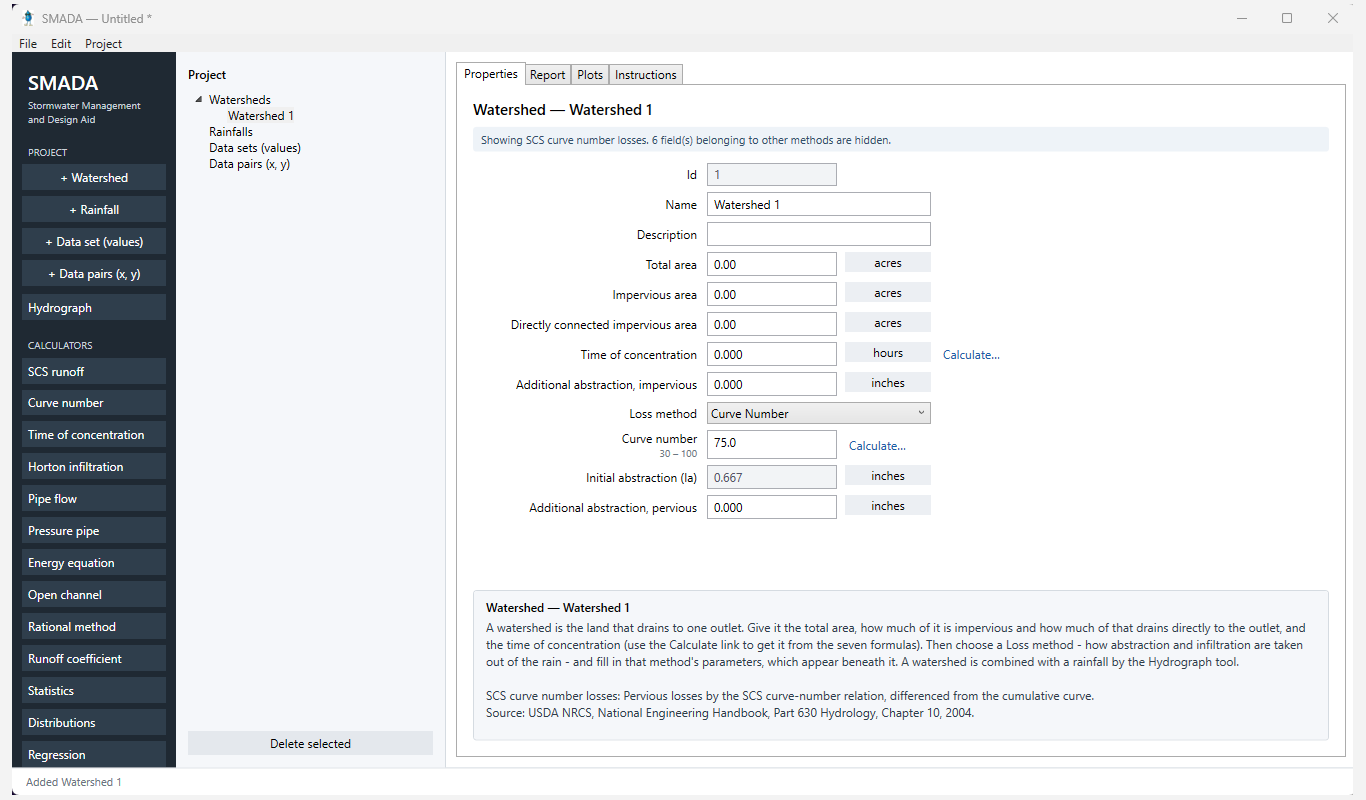
- Watershed — Holds a drainage area's size, directly connected impervious area, time of concentration and loss method, and turns each step of a storm into excess rainfall for the Hydrograph tool, weighting the connected and unconnected parts by area as TR-55 does.
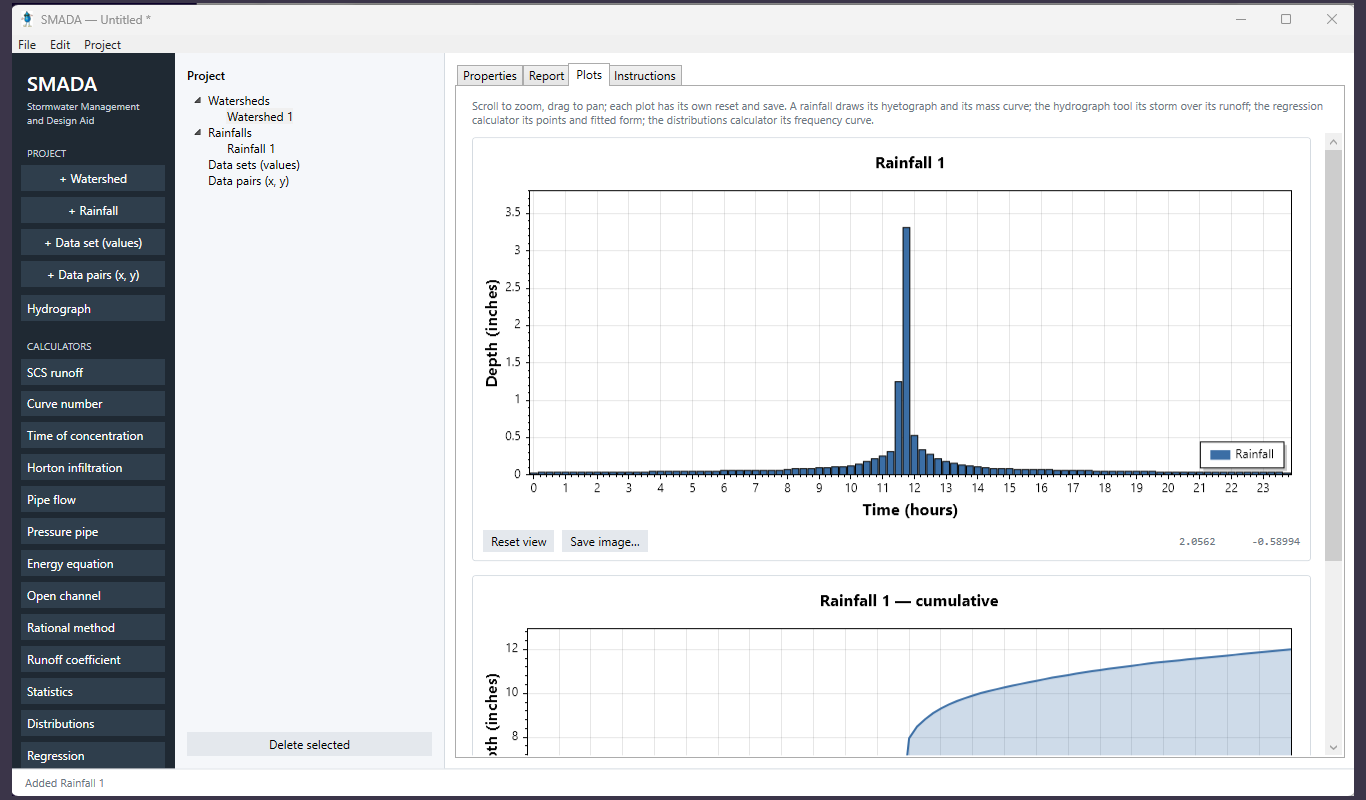
- Rainfall — A design storm as depths against time, typed in or generated from a total depth, a storm duration and a published dimensionless mass curve such as the NRCS TR-20 Type II table.
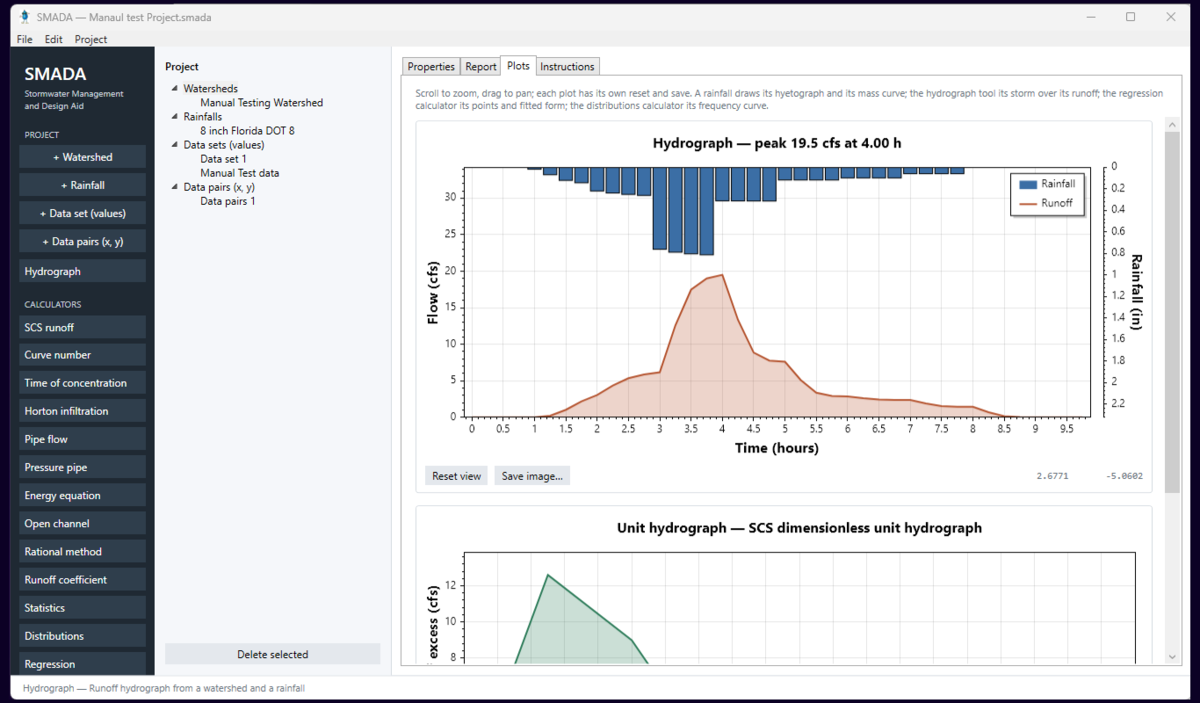
- Hydrograph — Turns a project rainfall on a project watershed into a runoff hydrograph, with its peak discharge, time to peak, runoff depth, losses and runoff volume.
Runoff and timing
- SCS runoff — Runoff depth, potential retention, initial abstraction and losses from a storm's total rainfall depth and an SCS curve number.
- Curve number — An area-weighted composite SCS curve number from the covers, soil groups and areas of a watershed, using TR-55 Table 2-2.
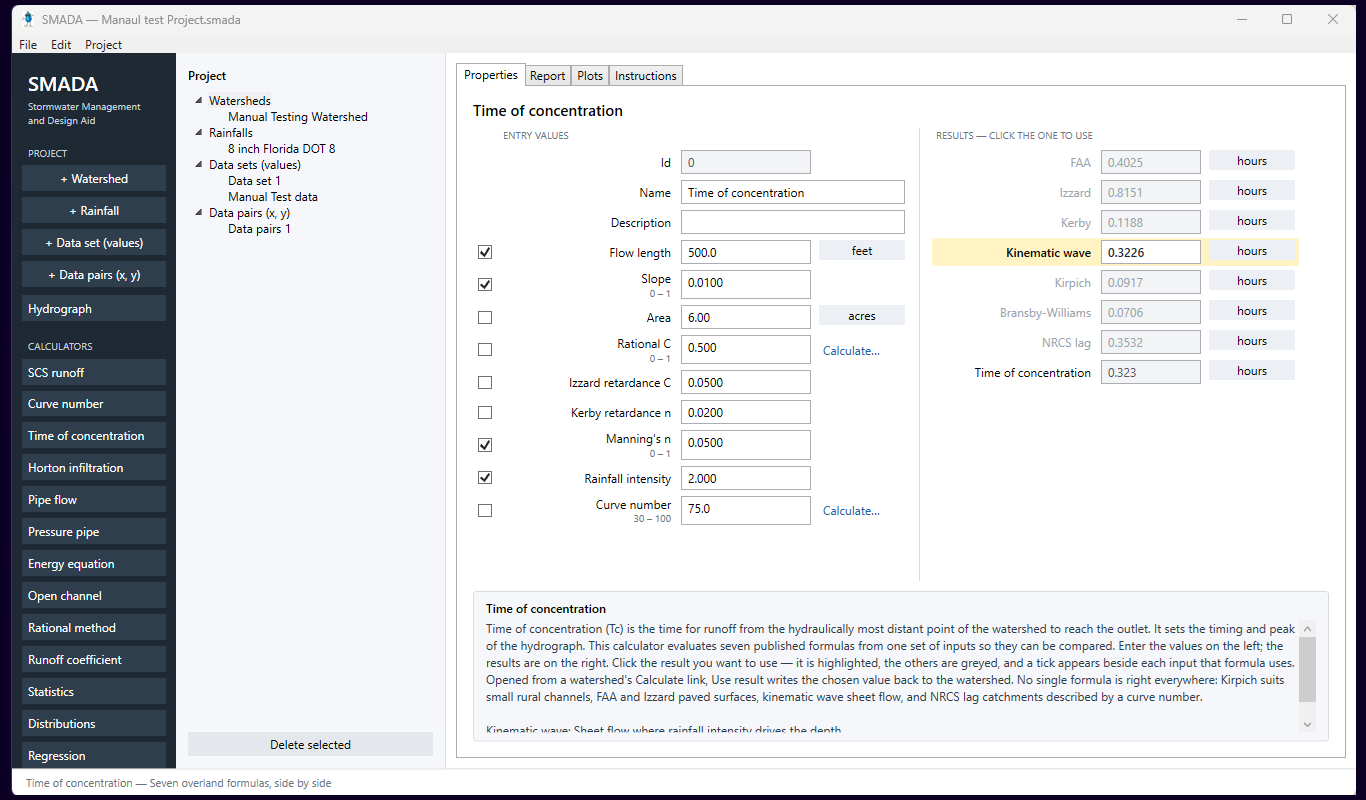
- Time of concentration — Computes the time of concentration by seven published formulas (FAA, Izzard, Kerby, kinematic wave, Kirpich, Bransby-Williams and NRCS lag) from one flow path, so you can compare them and pick the one to use.
- Horton infiltration — Finds a soil's infiltration rate and the depth infiltrated at a given elapsed time from Horton's fo, fc and k, and recovers the rate from that depth by the inversion SMADA's loss engine uses.
- Rational method — Finds the peak discharge from a small catchment, Q = 1.008 C i A, from its runoff coefficient, the design rainfall intensity and its area.
- Runoff coefficient — Builds an area-weighted rational-method runoff coefficient C from the covers in a catchment, each with its quality, hydrologic soil group and area.
Flow
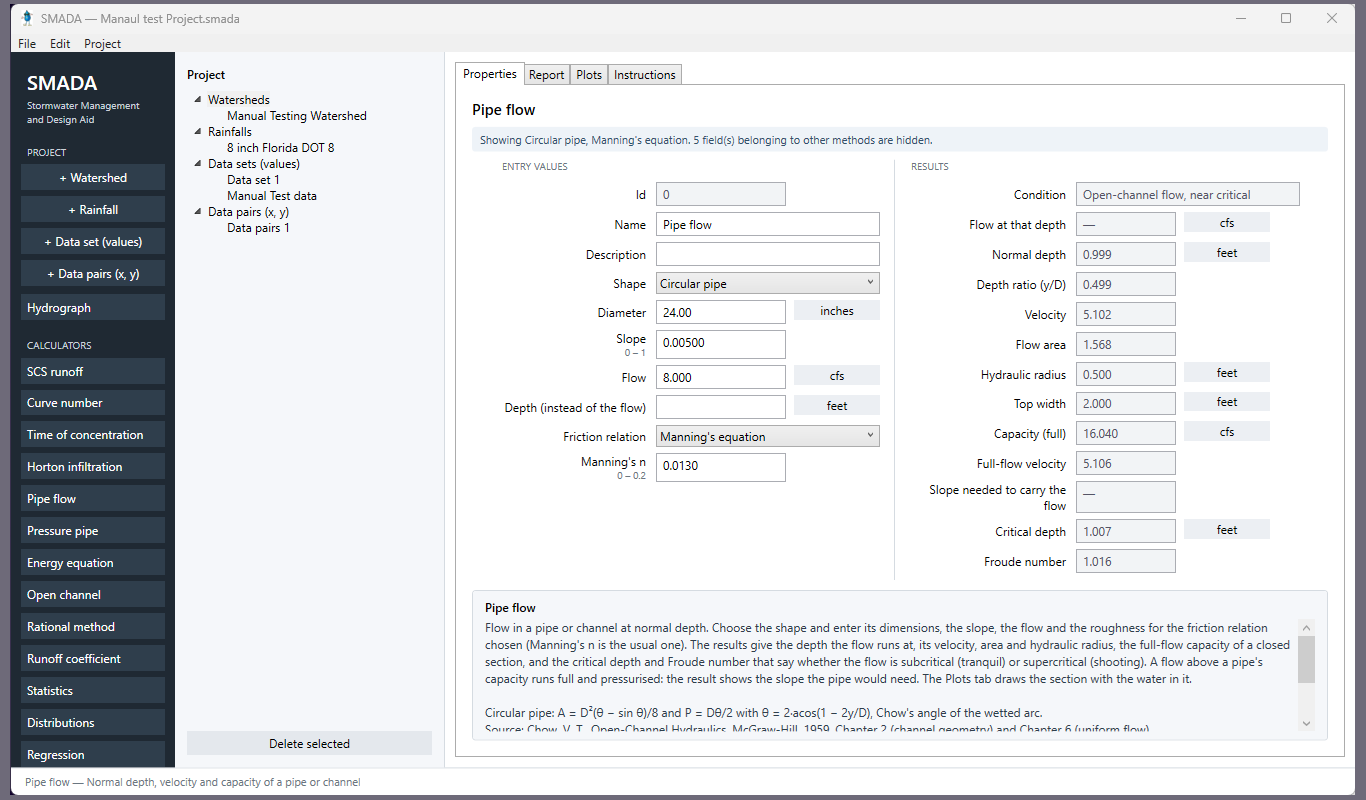
- Pipe flow — Normal depth, velocity, full-flow capacity, critical depth and Froude number of a circular pipe, box culvert or open channel in uniform flow, from its shape, slope, roughness and flow, with a storm-sewer design check.
- Pressure pipe — For a circular pipe flowing full, finds whichever of diameter, flow, velocity, friction coefficient and friction slope you leave blank from the ones you enter, by Darcy-Weisbach, Hazen-Williams or Manning, plus the head loss over a length.
- Energy equation — Bernoulli's equation with a head-loss term between two points along a pipe: finds the one elevation, pressure, velocity or head loss you leave blank from the rest.
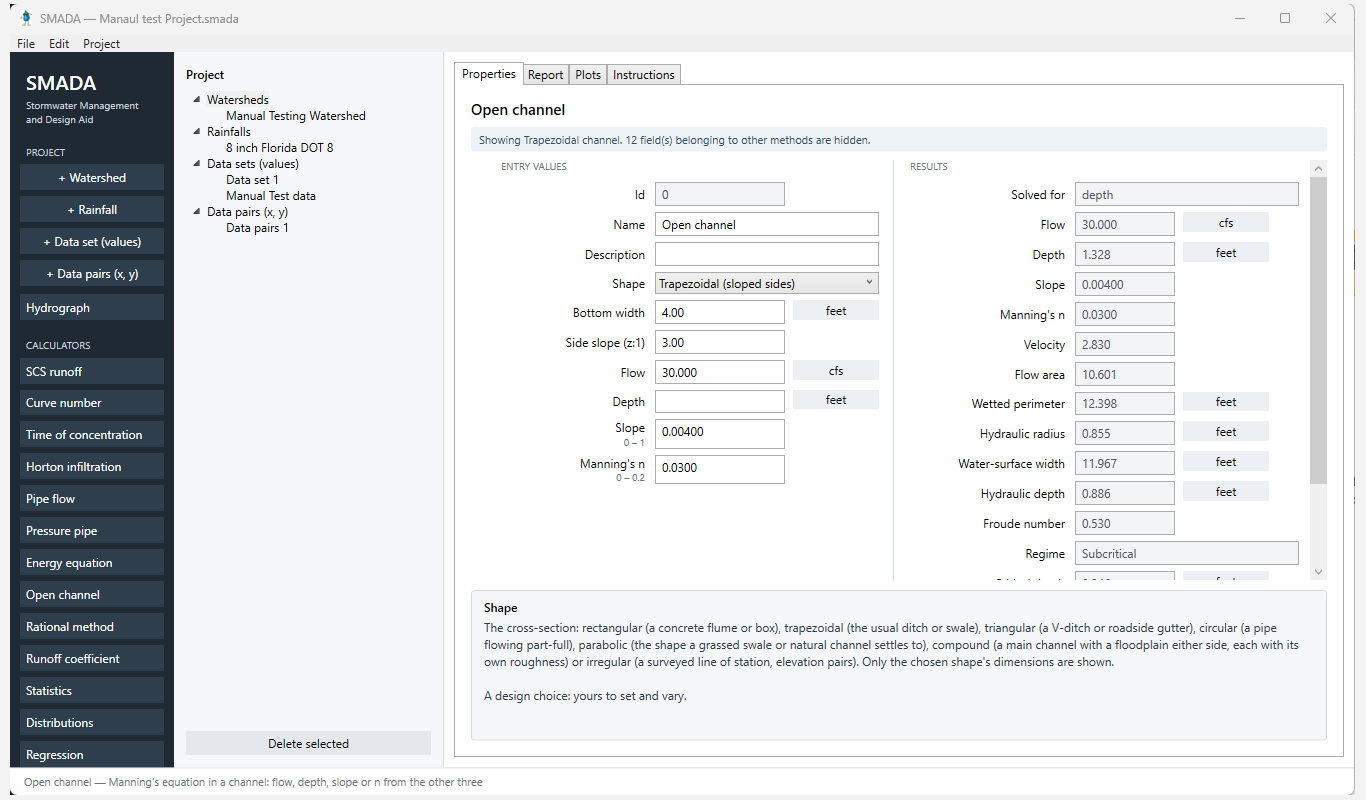
- Open channel — Finds the one of flow, depth, slope or Manning's n you leave blank for steady uniform flow in a channel of any of seven shapes, a surveyed section divided at its bank stations, with velocity, Froude number, critical depth and slope, specific energy and shear stress.
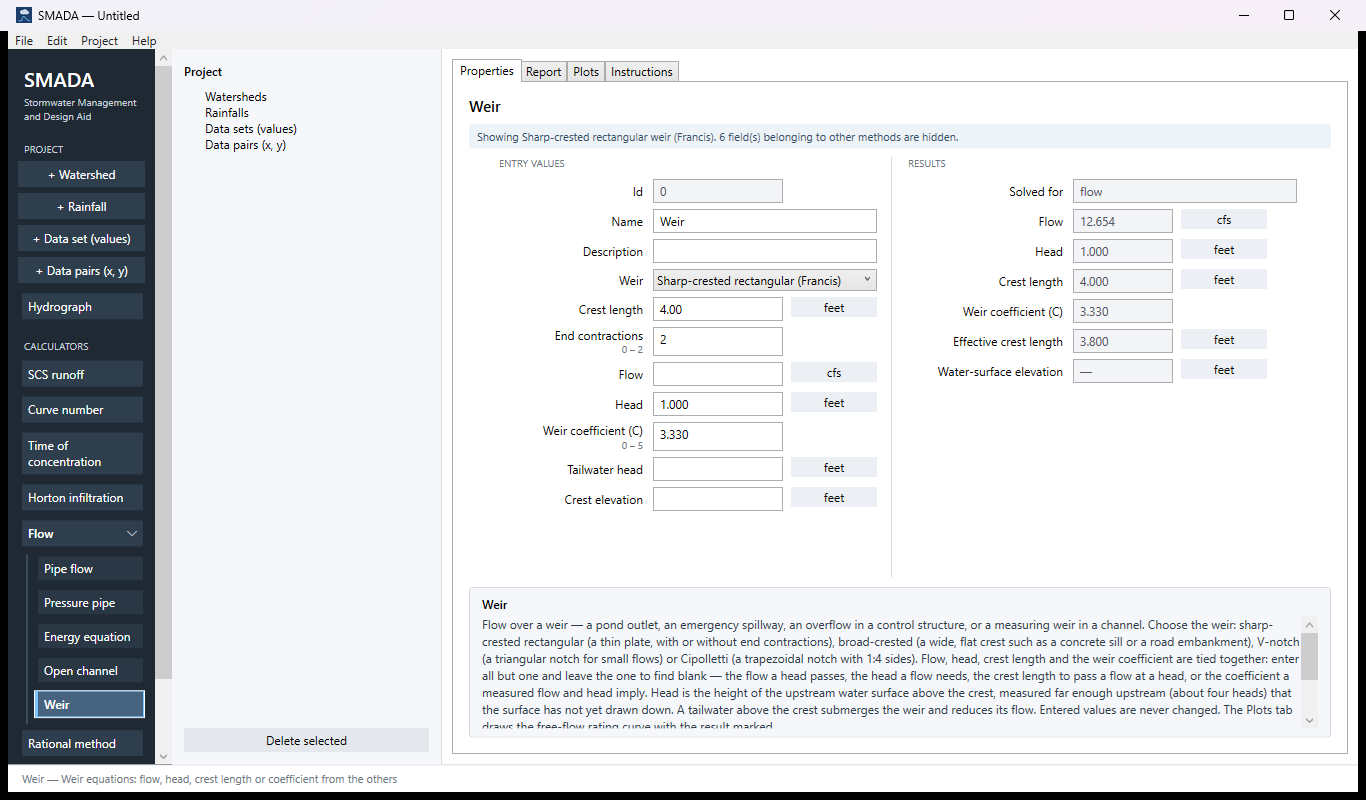
- Weir — Finds the one of flow, head, crest length or weir coefficient you leave blank for a sharp-crested, broad-crested, V-notch or Cipolletti weir, with Villemonte's reduction for a submerged weir and a free-flow rating curve.
Statistics
- Data series — The mean, standard deviation and skew of a record of annual maxima, and the Gumbel estimate of the event with a chosen return period.
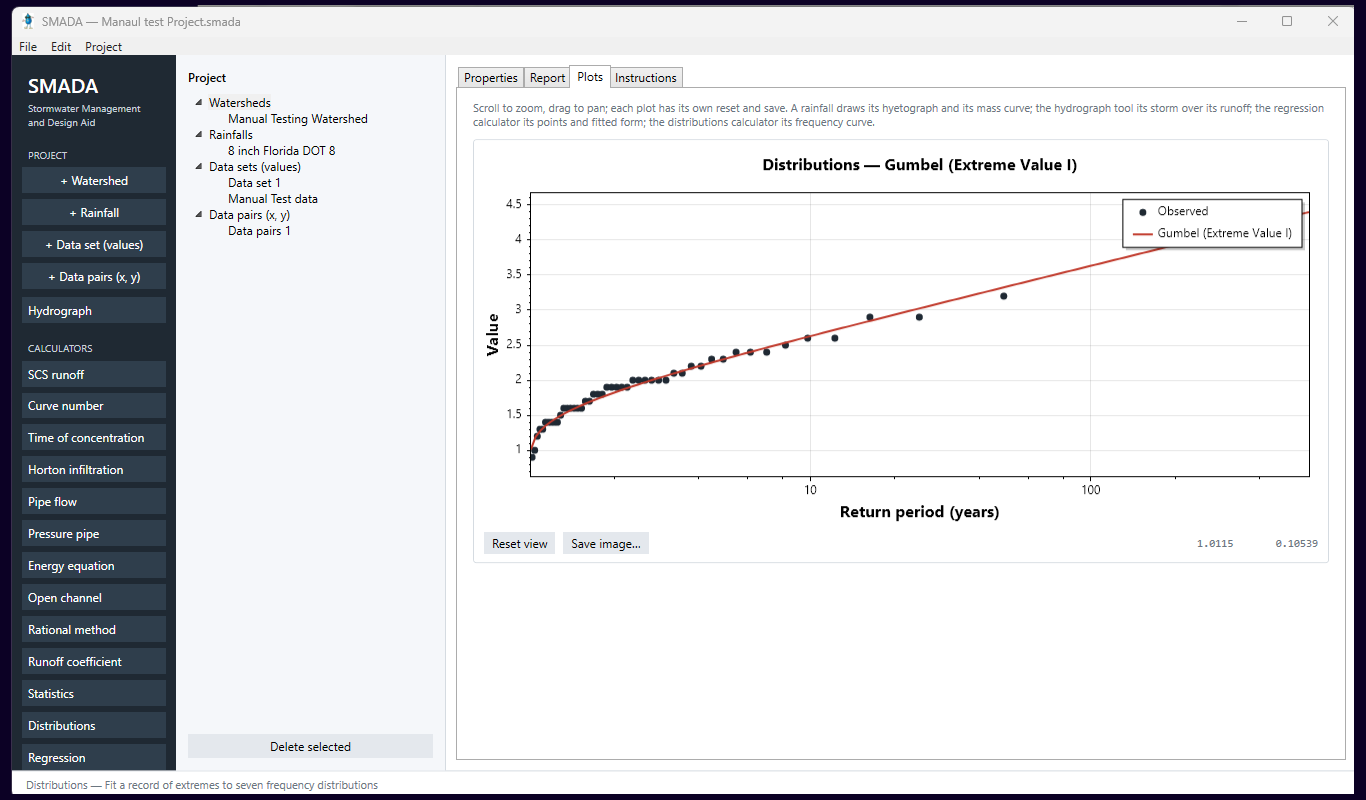
- Distributions — Fits a record of extremes to seven frequency distributions, compares how well each fits, and gives the chosen one's 2- to 200-year estimates with their standard errors.
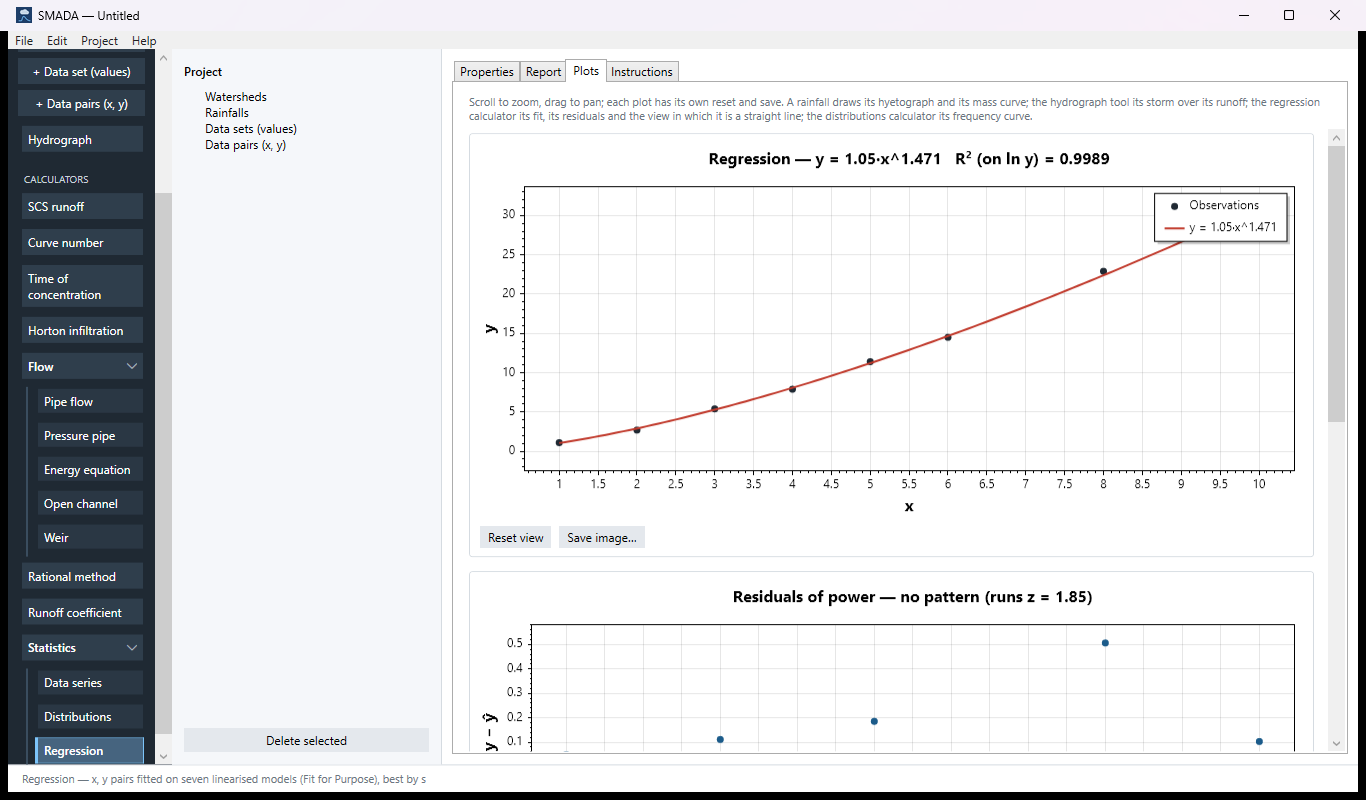
- Regression — Fits x, y pairs by least squares on seven linearised models and picks the best by the typical error in y, after eliminating models with a residual pattern or a term that is not significant.
What you can do
Rainfall and runoff
- Build design storms from dimensionless rainfall curves, or enter them depth by depth, and see the hyetograph and mass curve.
- SCS (NRCS) curve-number runoff, with the curve number built up from TR-55 cover types.
- Horton infiltration, and the rational method with an area-weighted runoff coefficient built from the same cover tables.
Watersheds and timing
- Time of concentration by seven formulas — NRCS, Kirpich, Izzard, Kerby, FAA, kinematic wave and Bransby-Williams — side by side, so you see the spread before you choose.
- Unit hydrographs: SCS gamma, SCS triangle, Snyder, Clark, rational, and your own unit hydrograph (S-curve).
- Convolution of a design storm with a unit hydrograph into a full runoff hydrograph.
Hydraulics
- Open-channel flow by Manning’s equation, including compound and irregular station-elevation sections with a different roughness for each segment.
- Pipe and channel flow at normal depth, pressure-pipe head loss, and the energy (Bernoulli) equation between two points.
- Weirs — sharp-crested (with end contractions), broad-crested, V-notch and Cipolletti. Enter all but one of flow, head, crest length and coefficient and the last is found; a tailwater above the crest is allowed for, and the rating curve is drawn.
Statistics
- Data series: descriptive statistics and a Gumbel estimate for a record of observations.
- Regression on seven models at once — linear, quadratic, logarithmic, power, exponential and the two reciprocals — each with R², adjusted R², its typical error s, the p-value of each term and a verdict. A model whose residuals follow a pattern, or with a term that is not significant, is ruled out; the best is the one left with the smallest s. Plots show the fit, its residuals and the view in which it is a straight line.
- Frequency analysis by seven distributions, for annual maxima, peak flows and other extremes.
How it works
- One .smada project file holds the watersheds, rainfalls and every calculation, so a whole design comes back exactly as you left it.
- A form shows only the entries the chosen method uses. Each entry knows its range, its units and its meaning, and a value out of range is flagged in the units you are working in.
- Units convert, not just relabel: change the project’s units and every form, plot and report follows.
- Any tool gives a report as text, HTML or PDF, plots of its figures, and a CSV of its values.
What it looks like
Who it is for
Students in a college hydrology or water-resources course, and practising engineers who want a quick answer they can check.
What it needs
A Windows 10 or Windows 11 PC. No account, and no internet connection needed.
Versions
1.1 (October 2026) — a Weir calculator (sharp-crested, broad-crested, V-notch and Cipolletti, with submergence and a rating curve); Regression rebuilt to compare seven models and rule out those that fail a residual or significance check; the calculators grouped into Flow and Statistics in the menu, with the open one highlighted; Help ▸ About links to this page.
1.0 (2026) — the first public release: the rainfall, runoff, timing, hydraulics and statistics tools, each with its method and citation shown, a manual page for every tool, unit conversion throughout, and reports as text, HTML or PDF.
Privacy
SMADA keeps your work on your own computer, in Documents\SMADA or wherever you choose, and sends none of it anywhere. It goes online only when you ask: to check the Microsoft Store for a new version, or to open a help page in your browser. Read the SMADA privacy policy.