SMADA help
SMADA (Stormwater Management and Design Aid) is a free Windows program that works out the numbers a stormwater design asks for: how much water runs off a piece of land in a storm, how fast it gets to the outlet, and how big a pipe, channel or weir must be to carry it. It also does the statistics hydrology leans on: frequency analysis of floods or rainfall, and regression.
It is for students in a college hydrology or water-resources course and engineers who want a quick answer they can check. It goes with the textbook Hydrology: Water Quantity and Quality Control (Wanielista, Kersten and Eaglin). Every result names the method used and where that method comes from, so you can check it by hand.
You do not need to know the program to start. These pages take you through it in order:
- The SMADA window — the column of buttons on the left, the project list, the four tabs (Properties, Report, Plots, Instructions), and how a form and its help panel work.
- Projects and files — start, open and save a project, the example projects, where your files are kept, Undo, and getting back unsaved work.
- Working with calculators — watersheds and rainfalls, the Hydrograph tool that joins them, filling a value from a calculator with Calculate…, data sets for the statistics, and importing numbers from a file.
- The calculators, one by one — every calculator in SMADA, grouped as the program groups them, each linked to its own page.
- Reports and plots — read the report, open it in your browser to print, save it as a PDF, export the numbers to a spreadsheet, and save a plot as a picture.
- The Help menu, About and new versions — help for the screen you are on (F1), help on this site, what the About window shows, and checking the Microsoft Store for a newer SMADA.
- Messages and what to do — red boxes, coloured bars, message windows and questions SMADA may show you, in its own words, and what each one means.
Before you start
Get SMADA free from the Microsoft Store (Windows 10 or Windows 11). When it has installed, open it from the Start menu. You need no account and no internet connection.
Your first hour: one worked example, end to end
This takes you from nothing to a runoff hydrograph (a graph of the flow leaving the land, hour by hour, during a storm) and a report you could hand in. Do part 1 first: it shows you a finished project, so part 2 makes sense.
Part 1 — look at a finished example
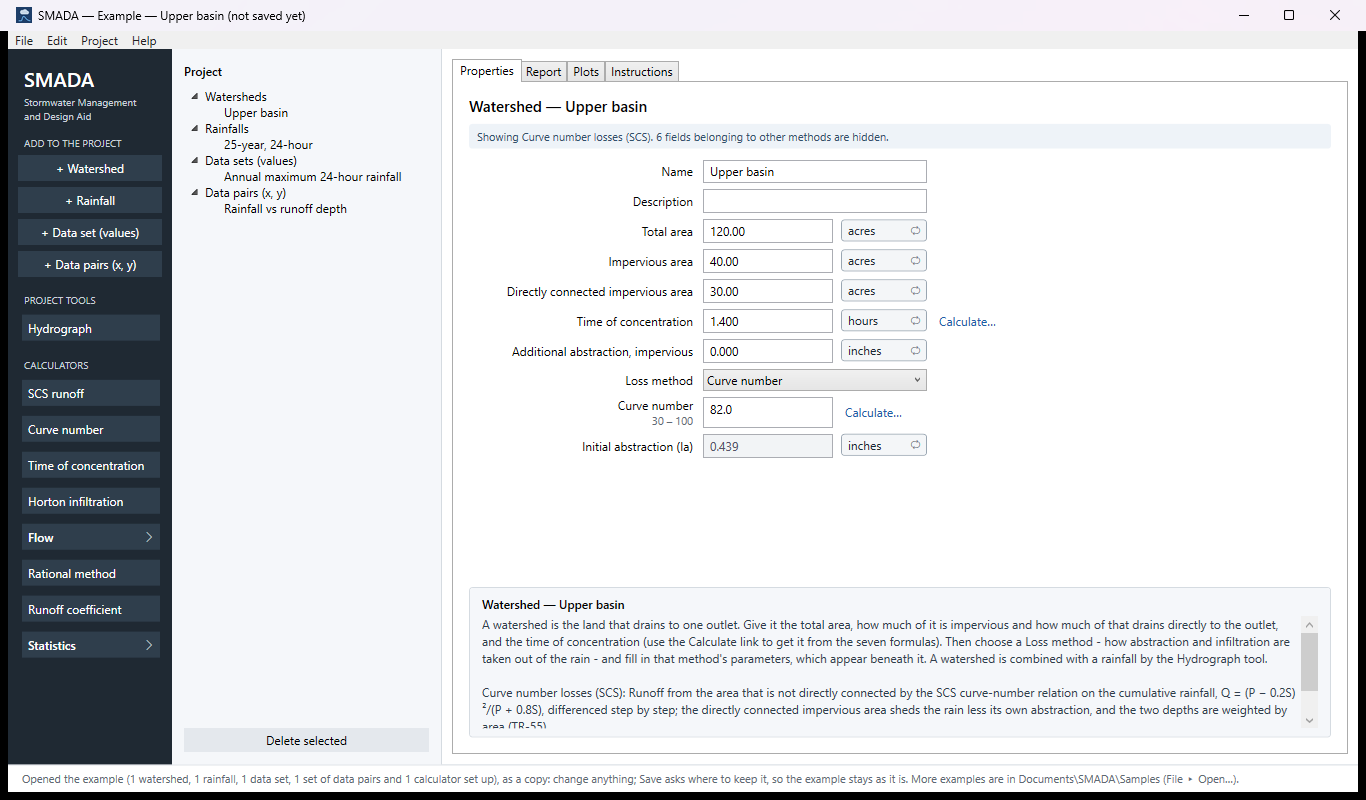
- Open SMADA. Choose File ▸ Open example project. A copy of the example opens, so you cannot spoil it: change anything you like. The title bar says Example — Upper basin (not saved yet).
- Look at the Project list, the second column. It holds a watershed called Upper basin (120 acres of land draining to one point), a rainfall called 25-year, 24-hour (a design storm of 8.6 inches), and two data sets for the statistics calculators.
- Click Upper basin. Its form opens on the right, on the Properties tab. Click into any box, such as Curve number: the panel at the bottom explains what that value is, its typical range and where the method comes from.
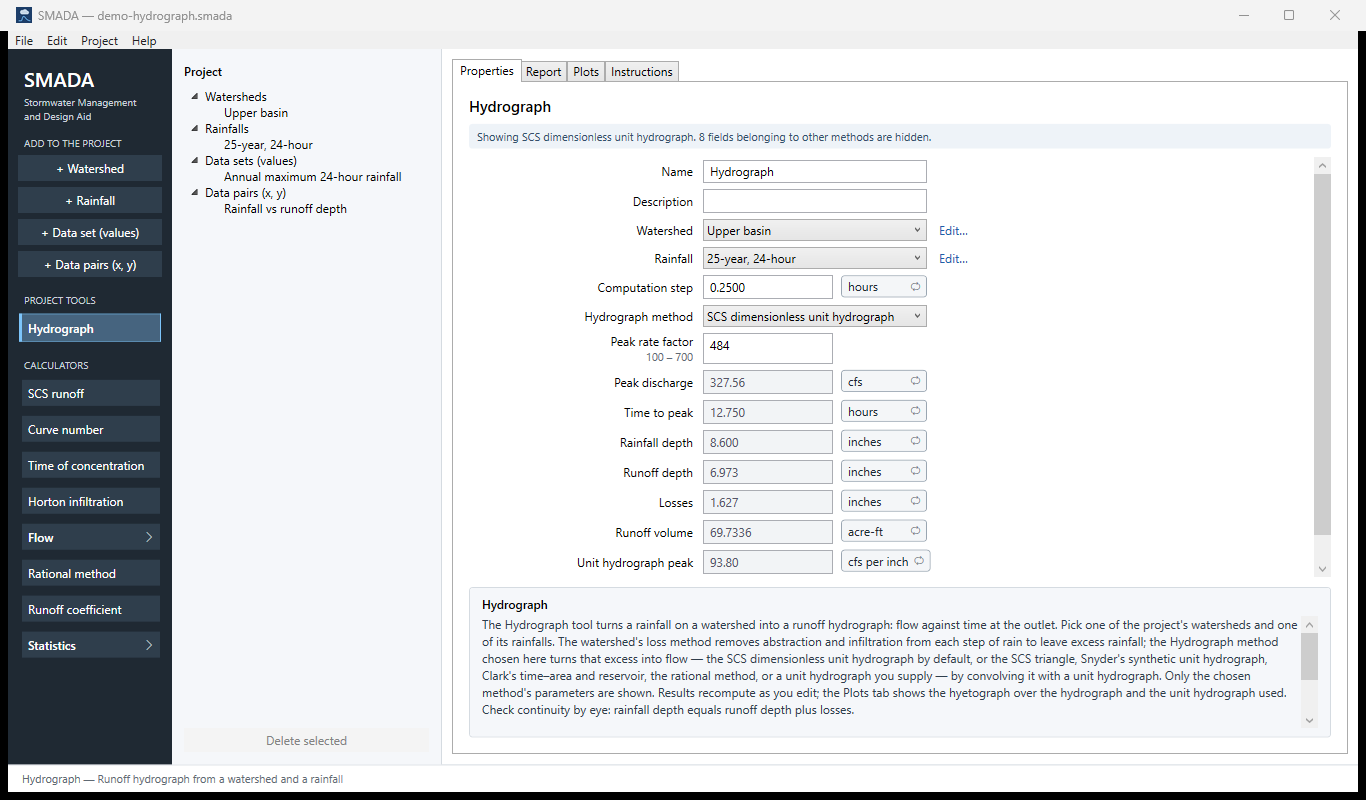
- In the dark column on the far left, under PROJECT TOOLS, click Hydrograph. It is already set up with Upper basin and 25-year, 24-hour. Read Peak discharge (the highest flow, about 328 cfs) and Time to peak (about 12.75 hours into the storm).
- Click the Plots tab: the storm hangs from the top and the runoff rises below it.
- Go back to Upper basin, change Curve number from 82 to 90, press Tab, and open Hydrograph again. The peak is higher: more of the rain runs off. Edit ▸ Undo (Ctrl+Z) puts the 82 back.
Part 2 — build your own
- File ▸ New project (Ctrl+N). If SMADA asks whether to save the example, choose No.
- The land. Click + Watershed in the left column. Type a Name (for example, Site, existing), then Total area, Impervious area (paved and roofed) and Directly connected impervious area (the part that drains straight to a pipe or ditch without crossing grass). Press Tab after each number so it is taken.
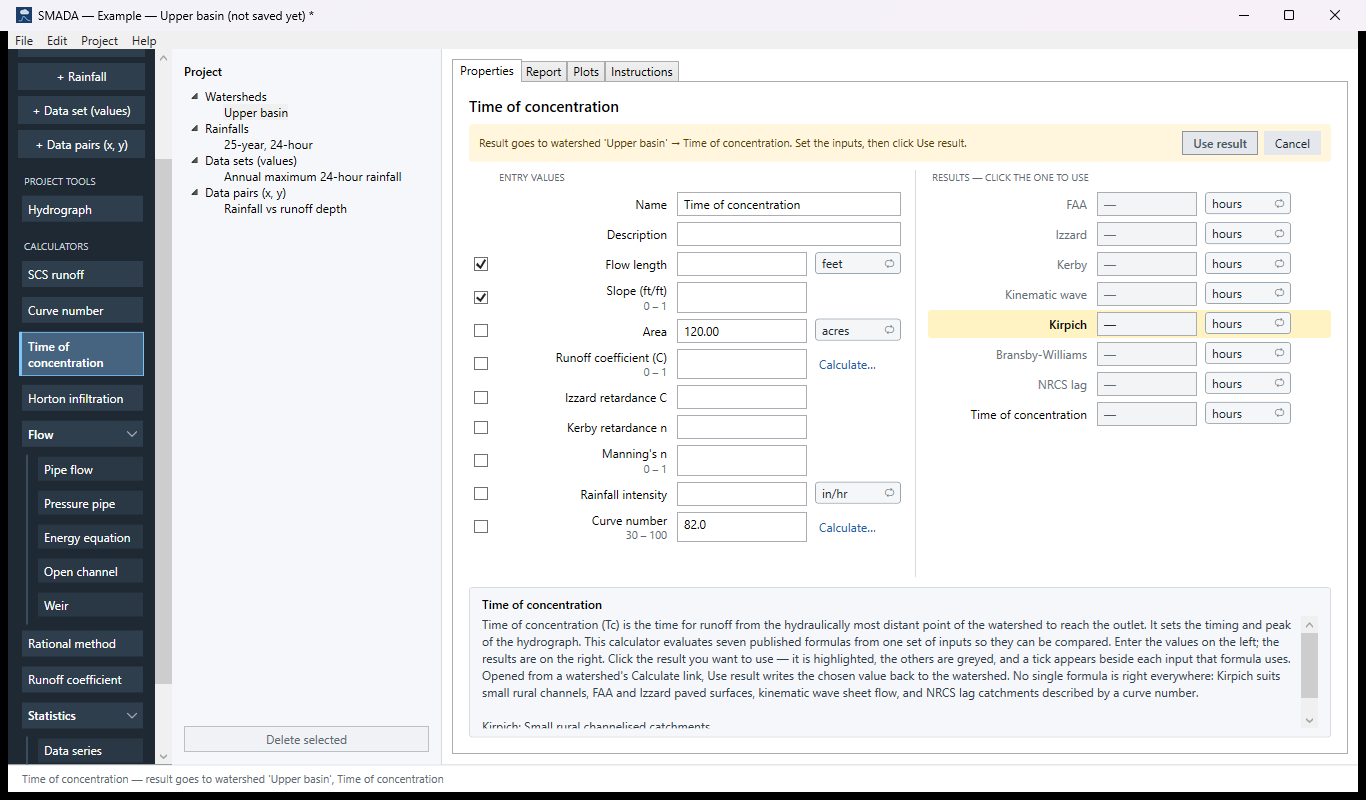
- How long the water takes. Beside Time of concentration, click the blue Calculate…. The Time of concentration calculator opens with a yellow bar that says where its answer will go. Fill in the flow path on the left (Flow length, Slope (ft/ft) and the rest the help panel asks for). Seven formulas answer on the right; click the one you want to use, then click Use result on the yellow bar. You are back on the watershed with the value filled in. (Use result stays greyed out until the formula you chose has an answer; rest the mouse on it to read what is missing.)
- How much rain soaks in. Leave Loss method on Curve number. Type a Curve number, or click Calculate… beside it to build one from the land covers and soil groups (TR-55 tables), and Use result.
- The storm. Click + Rainfall. Set Method to Dimensionless curve, choose a Dimensionless curve such as SCS Type II, 24 hour, and type the Total depth of rain for your storm. The Depths fill in by themselves (grey, because SMADA made them). Open Plots to see the storm's shape.
- The runoff. Click Hydrograph under PROJECT TOOLS. Choose your watershed in Watershed and your storm in Rainfall. Read Peak discharge, Time to peak, Runoff depth and Runoff volume. A good check: Rainfall depth equals Runoff depth plus Losses.
- Hand it in. Click the Report tab, then Save report as PDF…. For every item in one PDF, use File ▸ Save project report as PDF….
- Keep it. File ▸ Save (Ctrl+S). The project is saved as one
.smadafile in Documents\SMADA unless you choose another folder.
Lost? Press F1 (or Help ▸ Help for this screen): it opens the Instructions tab, a full manual page for whatever is selected, with a worked example. With nothing selected, it explains SMADA as a whole. Help ▸ Help on the web opens the selected calculator's own page on this site. Rest the mouse on any box, button or tab to read what it is for.
Words used here
- Project — one
.smadafile holding your watersheds, rainfalls, data sets and every calculator's numbers. - Watershed — the land that drains to one outlet: its area, how much is paved, and how rain soaks into it.
- Rainfall — a design storm: how much rain falls in each step of time.
- Hydrograph — the flow at the outlet against time. Its highest point is the peak discharge.
- Calculator — a tool in the left column that works one thing out (a pipe's capacity, a time of concentration). Each opens with a textbook example already in it.
- cfs — cubic feet per second, a rate of flow. Click any unit to see the values in other units.
Which version these pages describe. These pages describe SMADA 1.2.0, the next update on the Microsoft Store (Help ▸ About SMADA shows which version you have). Version 1.1, on the Store since 15 October 2026, differs in a few places; each page says how, in a box like this one.