The SMADA window
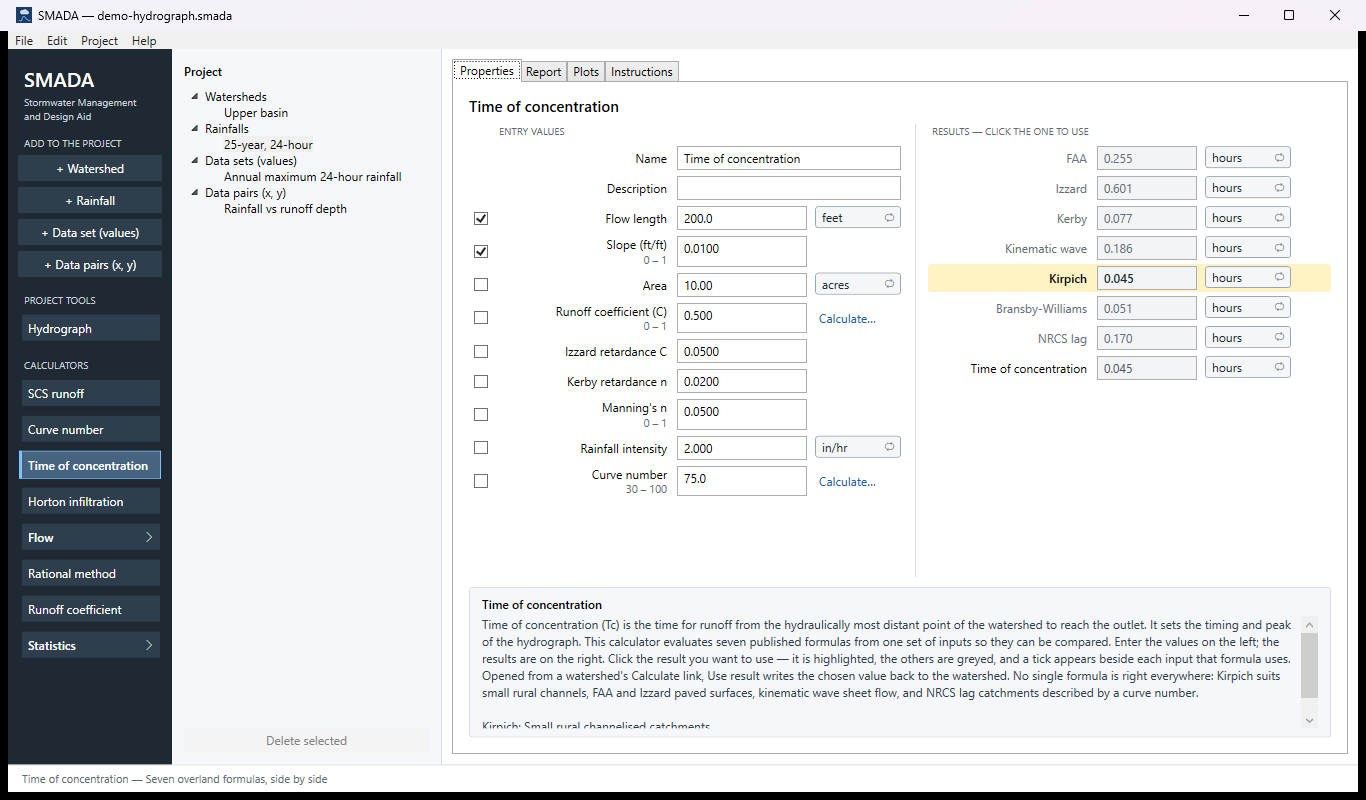
SMADA has one window. From left to right: a dark rail of buttons, the Project list, and the tabs that show whatever you have selected. A menu bar runs along the top and a status line along the bottom.
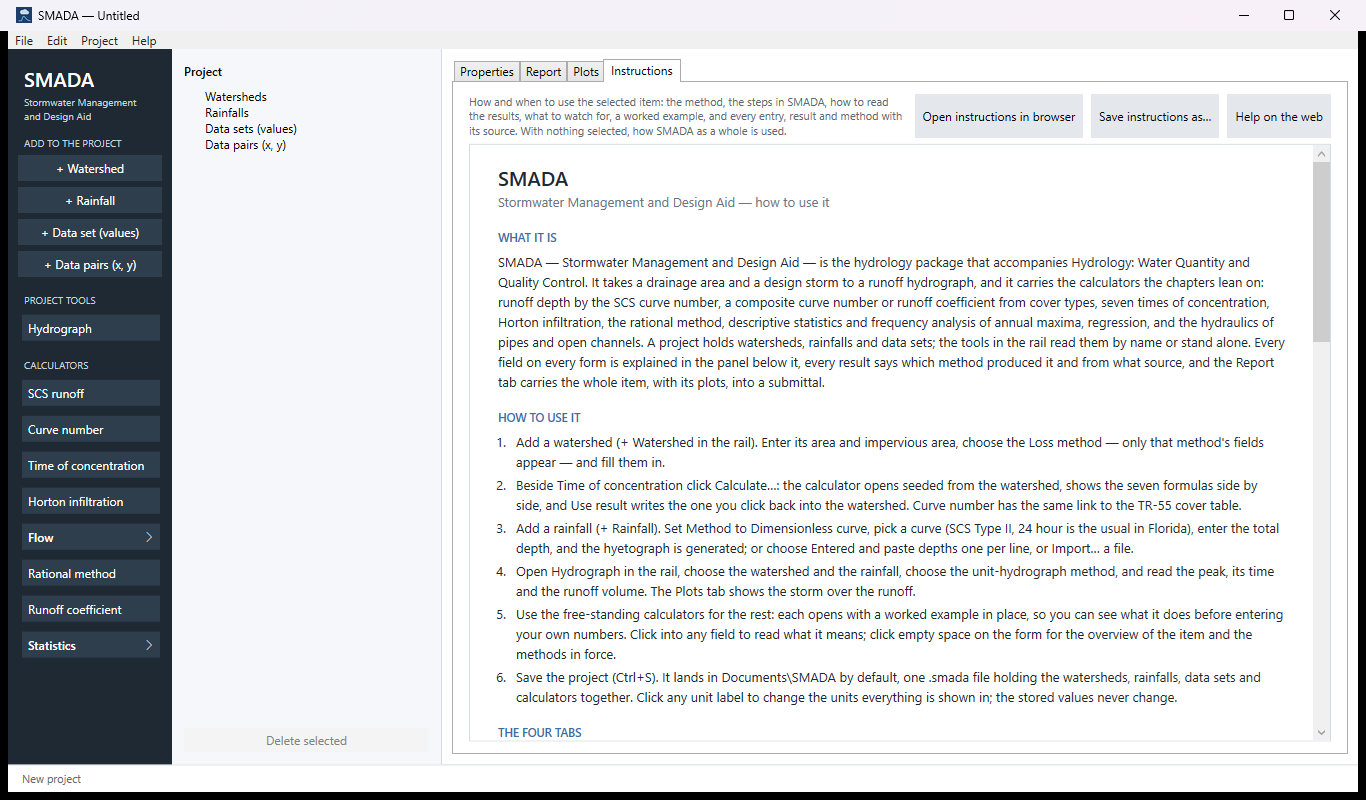
The rail (the dark column on the left)
- ADD TO THE PROJECT — four buttons that add a new item to your project: + Watershed, + Rainfall, + Data set (values) (a list of numbers, such as the largest rainfall of each year) and + Data pairs (x, y) (pairs of numbers for regression). The same four are in the Project menu.
- PROJECT TOOLS — Hydrograph, the tool that runs one of your rainfalls over one of your watersheds.
- CALCULATORS — the tools that stand on their own. Flow and Statistics are groups: click one (it has a › mark) to open it and show the calculators inside; click it again to close it. See the calculators, one by one.
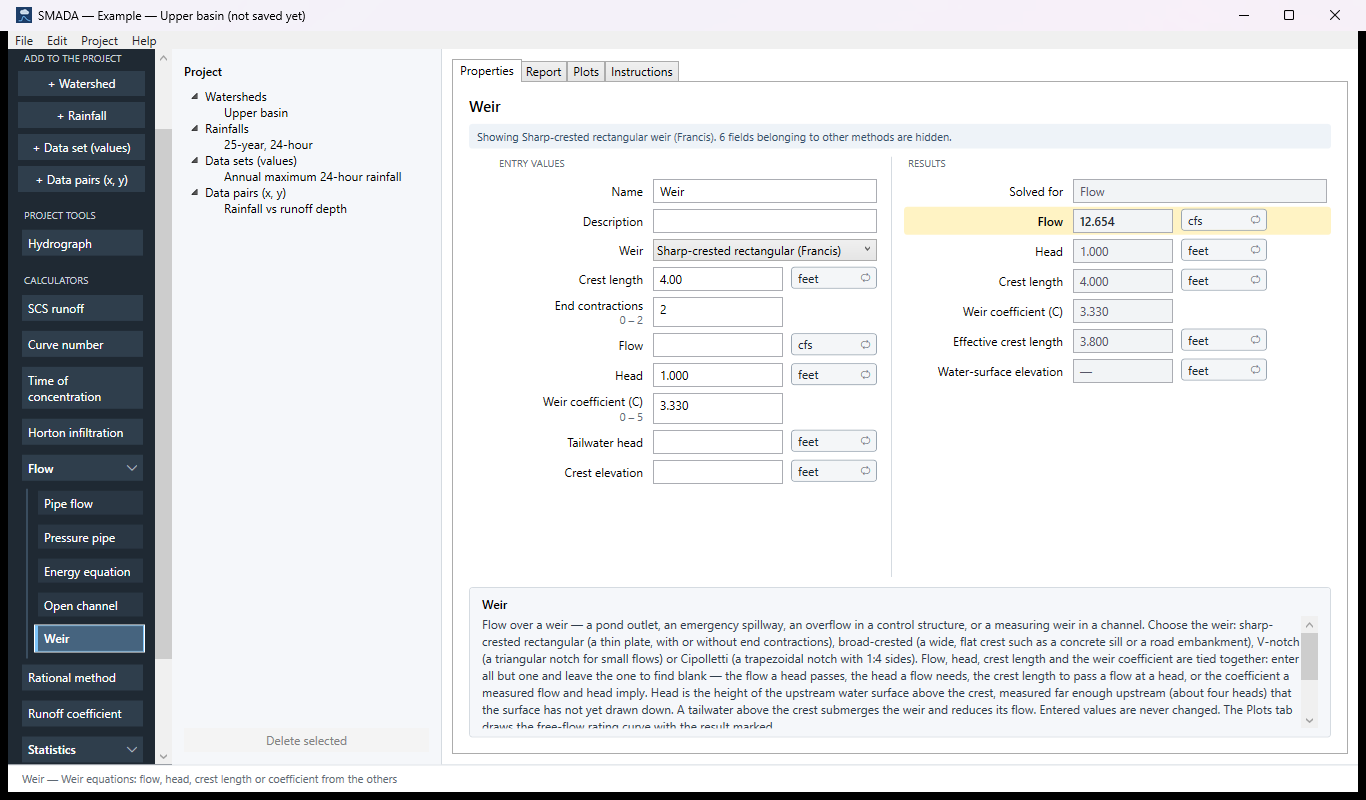
The tool that is open on the right is marked in the rail by a lighter button, a light-blue bar down its left edge and bold text. If it is inside a closed group, the group's header shows the bar. Rest the mouse on any button to read what it does: every button, tab and menu command has a short tip.
The Project list (the middle column)
Everything you have added, under four headings: Watersheds, Rainfalls, Data sets (values) and Data pairs (x, y). Click an item to open it on the right. To rename one, change its Name on its form; the list follows.
Delete selected, at the foot of the list, removes the selected item from the project. Edit ▸ Undo (Ctrl+Z) brings it back. Calculators are not deleted: each keeps its numbers in the project, so the button is greyed out while a calculator is open.
The four tabs
- Properties — the form: what you type in, and the results. Most of your work happens here.
- Report — the same values set out as a report, with the plots and the sources of the methods. See reports and plots.
- Plots — every graph the item draws. A rainfall draws two (the depth in each step, and the running total); a watershed draws none.
- Instructions — a full manual page for the selected item: what it is, when to use it, the steps in SMADA, how to read the results, what to watch for, a worked example, and every entry, result and method with its source. With nothing selected, it explains SMADA as a whole. Three buttons sit above it: Open instructions in browser, Save instructions as… (a web page or plain text) and Help on the web, which opens the selected item's own page on this site (for example Time of concentration), or these help pages for a data set or when nothing is selected. F1 brings you to this tab from anywhere.
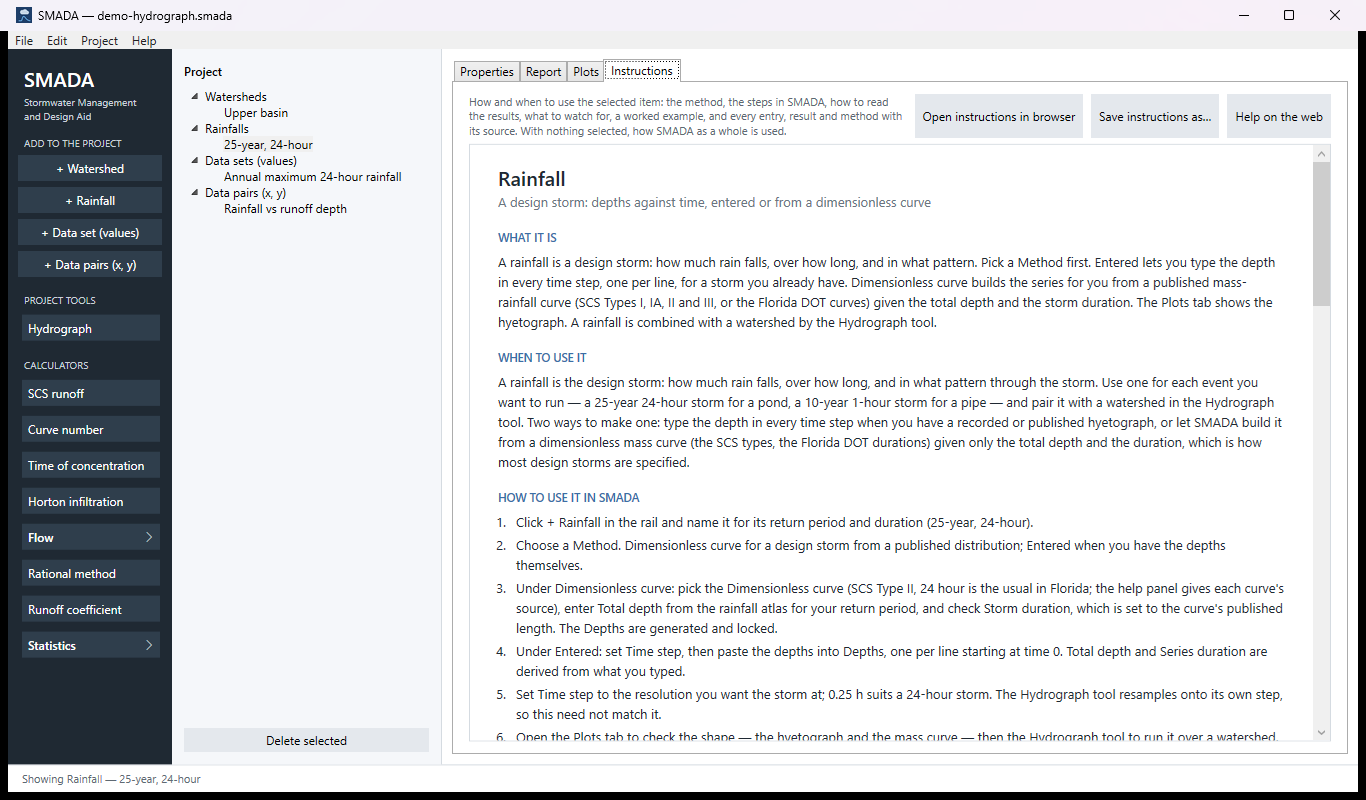
The form, on the Properties tab
SMADA shows only the boxes the chosen method uses. Change the Loss method of a watershed from Curve number to Horton, and the curve number boxes give way to Horton's rates. A blue note under the heading says which method is showing and how many boxes belong to other methods and are hidden.
- White boxes are for you to type in. Clicking into one selects what is there, so typing replaces it. A number is taken when you press Tab or Enter, or click elsewhere. Rest the mouse on a box for a short tip, such as Curve number: type a number. Expected between 30 and 100. Click the field and its full help shows in the panel under the form. — what it is, its units, the range it is expected in and, on a calculator with several formulas, whether the chosen one uses it.
- Grey boxes are results, or values SMADA makes for you (a rainfall's depths made from a curve, a data set's values copied from the set you chose). You cannot type in them; change what they come from.
- A range under a label, in small grey text (for example 100 – 700), is the range that value is expected in, in the units shown.
- A red box means the value is outside its range, or what you typed could not be read as a number. Rest the mouse on it to read why; the red bar above the form says it too. See messages.
- A blank box means "not entered yet", not zero. A calculator that needs it says so.
- The unit button beside a value (for example acres or cfs) changes the units. Click it and every value of that kind in the whole project is shown in the next unit — acres to hectares, and so on. Only the display changes; the stored values stay as they are.
- Calculate… (blue, beside a value) opens the calculator that can work that value out, and brings its answer back. Edit… (blue, beside a watershed, rainfall or data set chosen by name) takes you to that item. Import… (beside a list of numbers) fills it from a file. See working with calculators.
- Lists of numbers (a rainfall's depths, a data set) go in a tall box, one value per line; pairs go one pair per line, x then y, separated by a tab, a comma or a semicolon.
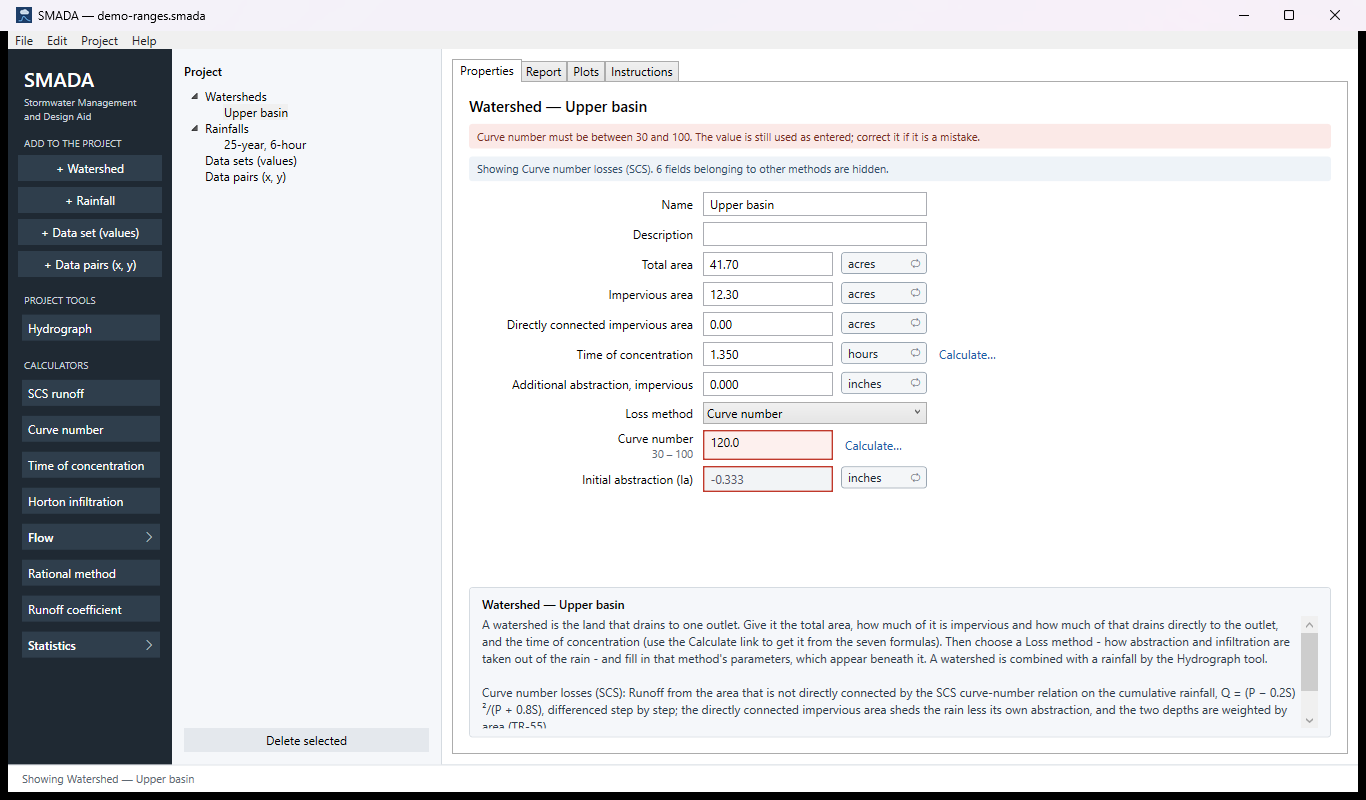
demo-ranges.smada, in Documents\SMADA\Samples): a curve number of 120. The box is red, the red bar says why, and the result that depends on it (Initial abstraction) is red too.A calculator that works one answer out several ways, such as Time of concentration, puts what you type on the left (ENTRY VALUES) and the answers on the right (RESULTS — CLICK THE ONE TO USE). Click an answer: it turns yellow and bold, the others turn grey, and a tick appears beside each entry that formula uses.
The help panel (under the form)
The bottom quarter of the Properties tab explains what you are looking at. Click into a box and it describes that box: what it is, typical values, its range, whether you give it or SMADA works it out, and which calculator can fill it. For a list to choose from, it adds the chosen option's details (a storm curve's length and source). Click empty space on the form and it goes back to the item as a whole, with the method in use and the source it comes from.
The status line (along the bottom)
One line that says what just happened — "Saved …", "Added …", "Deleted …", "Undone. Edit ▸ Redo (Ctrl+Y) puts the change back." — or what the open tool does. When something does not work (a file that cannot be saved or opened, a PDF that cannot be written), SMADA also says so in a message window, with what to do next; see messages.
Keys
| Keys | Does |
|---|---|
| Ctrl+N | New project |
| Ctrl+O | Open a project |
| Ctrl+S | Save |
| Ctrl+Z | Undo |
| Ctrl+Y | Redo |
| F1 | Help for this screen: the Instructions tab for whatever is selected |
| Tab | Take the number you typed and move to the next box |
In version 1.1: the rail's first heading reads PROJECT, there is no Redo (Ctrl+Y), no F1 and no Help on the web button, most boxes and buttons have no tip when you rest the mouse on them, and the buttons above the Report and Instructions tabs are shorter: Open in browser, Save as PDF…, Save as….