Reports and plots
Every watershed, rainfall, data set and calculator in SMADA has a report and, where it has something to draw, plots. You can hand the report in, print it, or take the numbers into a spreadsheet.
The Report tab
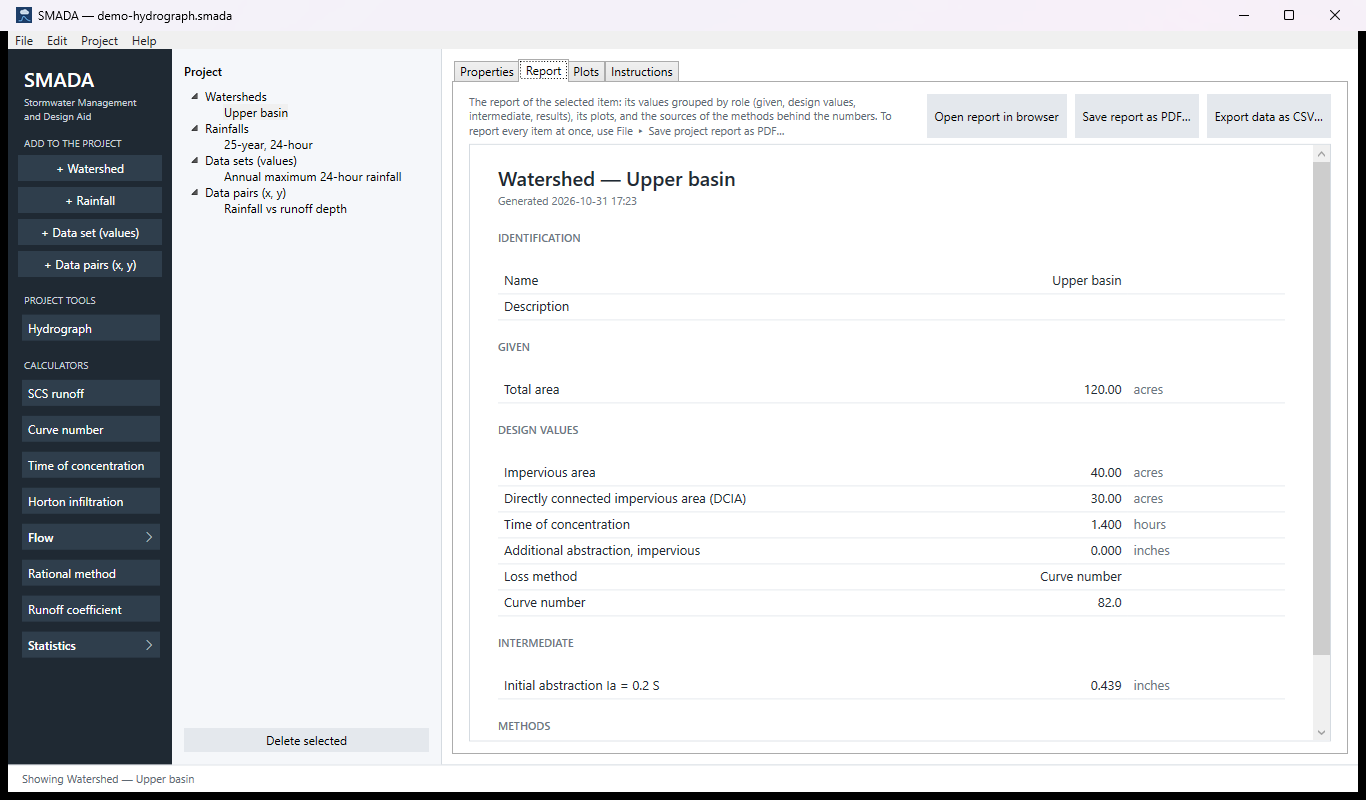
Select an item, then click the Report tab. The report shows its values grouped by what they are:
- Identification — the item's name and description;
- Given — facts you entered, such as an area;
- Design values — choices you made, such as the loss method;
- Intermediate — values worked out on the way;
- Results — the answers;
- Methods — each method used, with the source it comes from.
The item's plots appear in place. A long list of numbers (a storm's depths) is shown as one summary line, such as its count and total.
Print, save or export a report
Three buttons sit above the report, and the same three are in the File menu. Each works on the item selected; with nothing selected they are greyed out, and resting the mouse on one says Select an item first.
| Button | What you get |
|---|---|
| Open report in browser | The report as a web page in your browser, plots included. To print it, use your browser's Print (Ctrl+P). To copy part of it into a document, select it in the browser and copy. |
| Save report as PDF… | The report as a PDF file, plots drawn on the page. SMADA asks where to save it. |
| Export data as CSV… | The numbers as a CSV file, which Excel and other spreadsheets open. The Hydrograph tool exports its flow at every time step; other items export their list of numbers, or the values in their report. |
File ▸ Save project report as PDF… makes one PDF of the whole project, each item on its own page: every watershed, rainfall and data set, then every calculator that has been opened in this project, in the order of the rail. Calculators never opened are left out. The status line then says, for example, Wrote Site.pdf: 5 items, each on its own page.
If the file cannot be written — most often because a PDF or spreadsheet of the same name is open in another program — SMADA says so in a message window: SMADA could not write … Your project is not affected. If the file is open in another program (a PDF reader), close it there and try again, or choose another name or folder. (Excel, for a CSV.) If your browser cannot be opened, the report is still on the Report tab, and Save report as PDF… keeps a copy.
The Plots tab
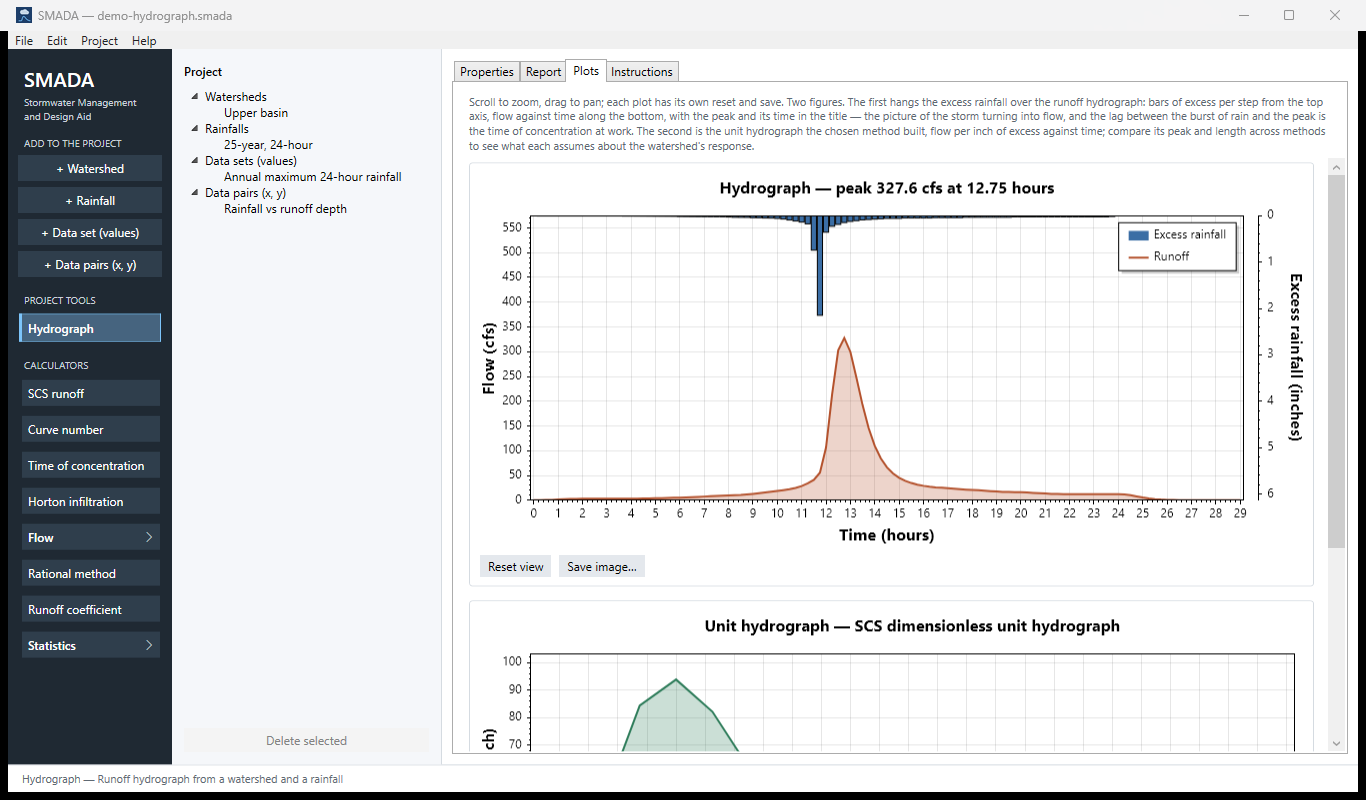
Select an item and click Plots: every graph it draws, one under another. A rainfall draws its incremental depths and its running total (mass curve); the Hydrograph tool the storm over the runoff, and the unit hydrograph it used; Pipe flow and Open channel the cross-section with the water in it; Weir its rating curve; Distributions its frequency curve; Regression the fit, its residuals and its straight-line view. A watershed has nothing to plot.
- Zoom with the mouse wheel; move the view by dragging.
- Reset view puts the plot back as it was.
- Save image… saves that plot as a PNG picture, ready to put into a document.
- The numbers in the plot's corner are the x and y values under the mouse pointer.
The Instructions as a document
The Instructions tab's manual page can be kept too: Open instructions in browser shows it as a web page (to read or print), and Save instructions as… saves it as a web page (.html) or plain text (.txt). Help on the web, beside them, opens the item's page on this site, with pictures of every tab and every equation.
Units in reports
Reports, plots and CSV files use the units the project is showing. To report in metric, click a unit button on any form to switch that kind of value (see the window), then make the report.
In version 1.1: the File menu says Report…, Export report as PDF… and Export data as CSV…; the buttons above the report say Open in browser, Save as PDF… and Export data as CSV…; and there is no project report — save each item's PDF in turn. A PDF or CSV that cannot be written is mentioned only on the status line.
← The calculators, one by one The Help menu, About and new versions →