Working with calculators
SMADA has two kinds of thing: items you add to the project (watersheds, rainfalls and data sets, listed in the middle column) and tools in the left rail that work answers out. Some tools use your items; the rest stand on their own. This page shows how they fit together. For what each calculator does, see the calculators, one by one.
Watershed + rainfall → Hydrograph
The main job in SMADA is turning a storm on a piece of land into the flow that leaves it. That takes three parts:
- A watershed (+ Watershed) — the land: Total area, Impervious area, Directly connected impervious area, Time of concentration, and a Loss method (Curve number, Horton or Constant rate) that says how much rain soaks in. Only the chosen method's boxes appear under it. Use one watershed for each condition you compare: before and after development are two watersheds, not one edited twice. More on the watershed.
- A rainfall (+ Rainfall) — the storm. Set Method to Dimensionless curve to build it from a published storm shape (pick the Dimensionless curve, type the Total depth), or to Entered to type the depth for each Time step yourself, one per line, starting at time 0. More on the rainfall.
- Hydrograph (under PROJECT TOOLS) — choose a Watershed and a Rainfall from the drop-downs, then a Hydrograph method (SCS dimensionless unit hydrograph unless you have a reason for another). The results follow at once: Peak discharge, Time to peak, Runoff depth, Losses, Runoff volume. Edit… beside the watershed or rainfall takes you to it; change it, come back, and the hydrograph has followed. More on the hydrograph.
Until both are chosen, a bar above the Hydrograph form says what is missing, for example This project has no rainfall yet. Add one with + Rainfall in the rail, fill it in, then choose it here.
Fill a value from a calculator: Calculate… and Use result
Some values on a form can be worked out by a calculator. Those have a blue Calculate… beside them. On a watershed: Time of concentration (the Time of concentration calculator) and Curve number (the Curve number calculator, from land covers and soil groups). Elsewhere: Runoff coefficient (C) (the Runoff coefficient calculator). Rest the mouse on Calculate… to see which calculator it opens.
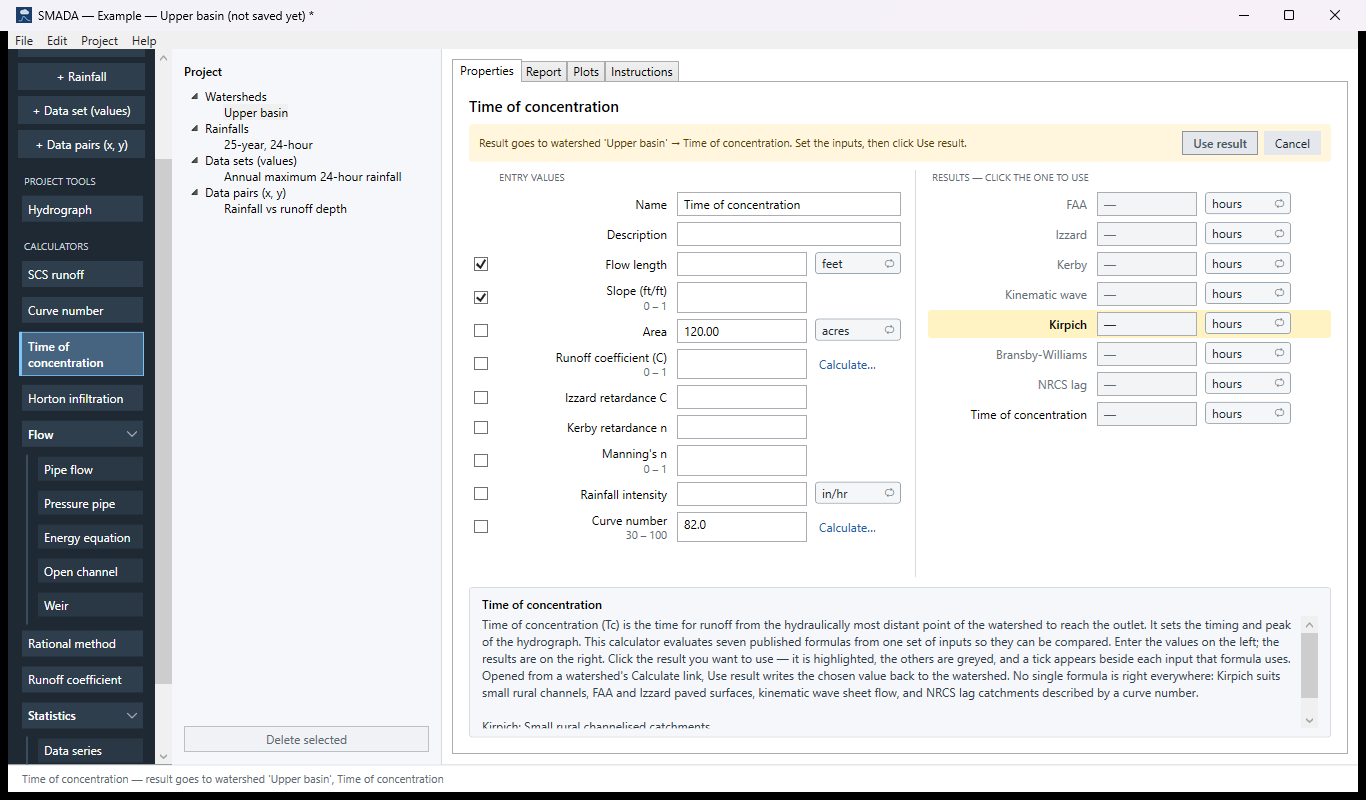
- Click Calculate…. The calculator opens with a yellow bar across the top: Result goes to (the item) → (the value). Set the inputs, then click Use result.
- It starts with what the item already knows (a watershed's area and curve number) and the rest blank. Fill in the rest. The help panel explains each box.
- Where there are several answers (Time of concentration has seven formulas), click the one to use.
- Click Use result. You are back on the item, with the value filled in and the status line saying where it came from. Edit ▸ Undo takes it back. Rest the mouse on Use result first and it says where the value will go.
- Changed your mind? Click Cancel on the yellow bar, or click anything else: nothing is written.
Use result is greyed out until there is a result. A blank answer is never written over a value you already have. Rest the mouse on the greyed button to read what is missing, for example Curve number has no result yet — give every row a cover and an area greater than zero, then click Use result. or, on Time of concentration, … fill in the entries the chosen formula needs (they are ticked), or click another formula's result … A time of concentration of zero (a formula with a zero length or slope) is not handed over either.
In the Curve number and Runoff coefficient calculators you build the answer from rows of land cover: add a row with + Add row under the grid, pick the cover and soil group, and type the area; remove a row with its × (Edit ▸ Undo brings it back). The composite stays blank until every row has a cover and an area greater than zero, and a red note above the form names the first row to fix.
A calculator opened this way remembers its numbers for that item: open it again from the same watershed and your entries are still there; open it from another watershed and it starts blank. These copies are saved with the project, and go when their watershed is deleted. The copy you open from the rail is separate and keeps its textbook example.
A value filled this way does not update by itself. If you later change the slope in the Time of concentration calculator, the watershed keeps the old value until you click Use result again.
Calculators on their own
Click any calculator in the rail. It opens with a worked textbook example already in it, so you can see what it does before you type your own numbers. Replace the example with your own values.
- Most calculators recompute as soon as you press Tab.
- Energy equation, Open channel and Weir find the one value you leave blank from the rest. Leave exactly one blank; if none or more than one is blank, a red bar says so. Pressure pipe ties five values together: enter any three and it finds the other two.
- Where a calculator offers a choice of method (a pipe's shape, a weir's type, a distribution), only that choice's boxes show.
- Every calculator's numbers are saved with the project.
Data sets for the statistics calculators
The three Statistics calculators work on lists of numbers. Keep a list as a project item and several calculators can use it:
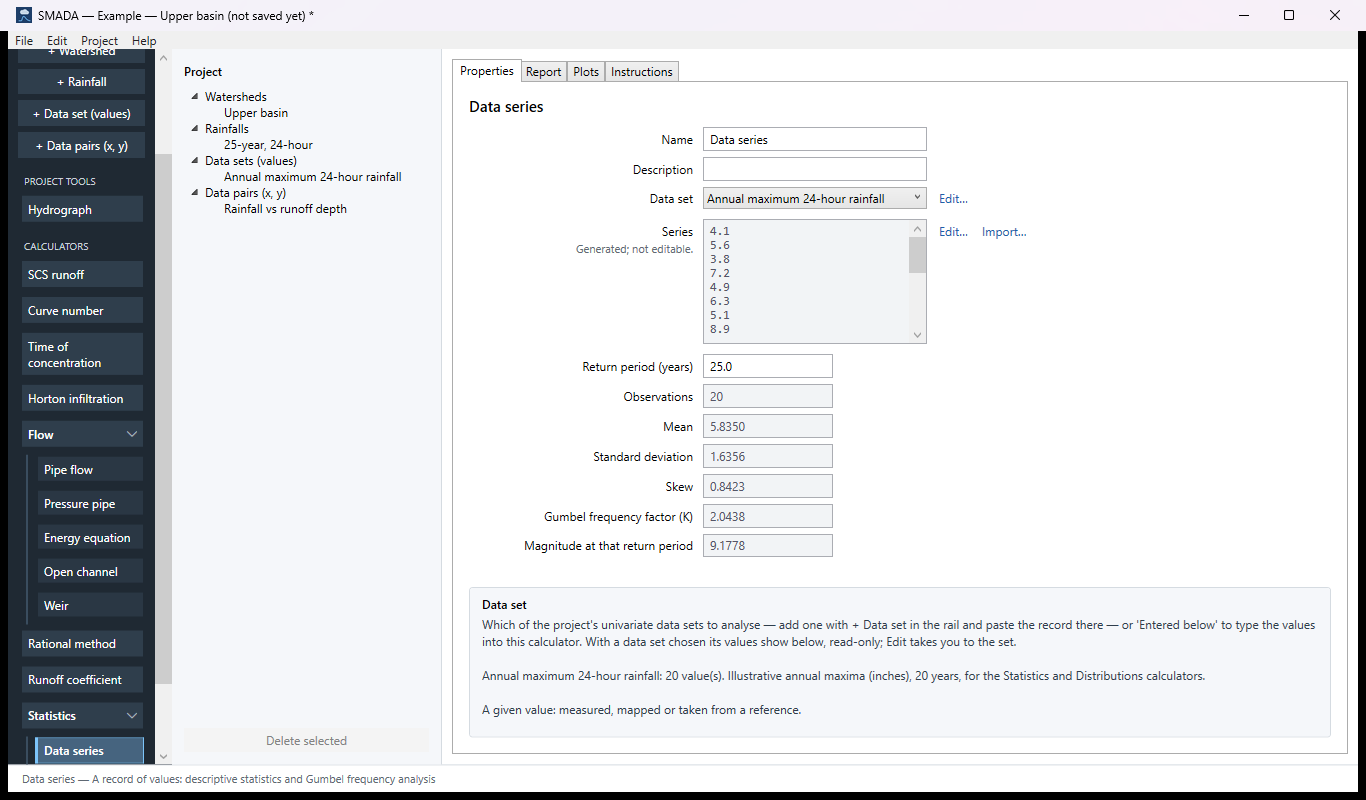
- + Data set (values) — one value per line, such as the largest rainfall of each year. Used by Data series and Distributions.
- + Data pairs (x, y) — one pair per line, x then y, separated by a tab, a comma or a semicolon. Used by Regression.
In the calculator, choose the set in the Data set list. Its values appear in the calculator, grey, with Edit… to go to the set; change the set and the analysis follows. Choose Entered below instead to type the numbers straight into the calculator.
Import numbers from a file
Import… appears beside a list you can type into (a rainfall's depths, a data set, regression pairs). It reads:
- a text or CSV file, with a tab, comma, semicolon or spaces between the columns;
- a DISTRIB
.xd2file; - an Excel
.xlsxworkbook (choose the sheet). The older.xlsis not read: save the sheet as.xlsxor.csvfirst.
The Import data window shows the rows. Choose the Value column (or the x column and y column; for an Excel workbook, first the Sheet), check the line that says how many will be imported (20 values will be imported (header row skipped).), and click Import. A heading row is recognised and skipped; cells that are not numbers are left out. The values now in the list are replaced; Edit ▸ Undo brings them back. Import is greyed out while the chosen column holds no numbers.
Units. For a list with a unit, such as a rainfall's Depths, the window says which unit the numbers are read in: The numbers are taken as in, the unit shown beside Depths; if the file uses another unit, Cancel, click the unit button to change it, then import again. (Rest the mouse on Import… to see it before you start.)
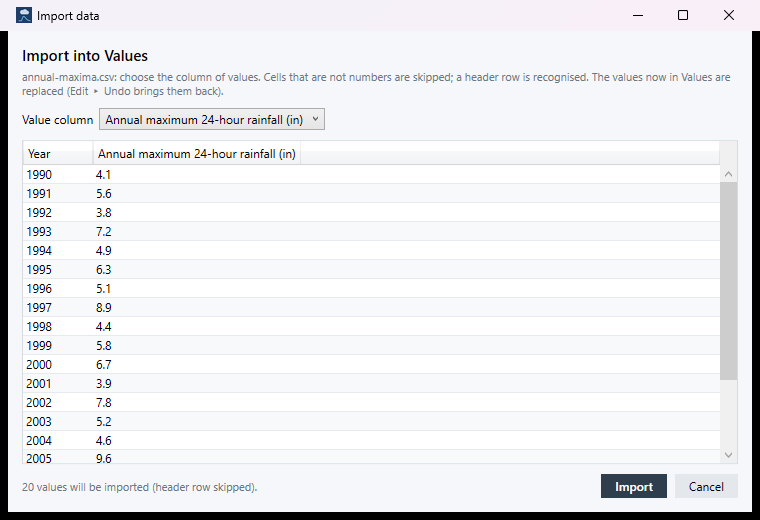
annual-maxima.csv (in Documents\SMADA\Samples) into the example's data set.In version 1.1: the bar that tells you to add a watershed or a rainfall before the Hydrograph can run is not there; add both, then choose them. Use result can be clicked while the calculator has no answer, and then writes a blank over the value (Edit ▸ Undo puts it back). The Import data window does not say which unit the numbers are read in: it uses the unit shown beside the list. The cover rows' help mentions the Delete key, which does nothing; use the row's ×.