
Runoff coefficient
Builds an area-weighted rational-method runoff coefficient C from the covers in a catchment, each with its quality, hydrologic soil group and area.
What it is for
The rational method needs one runoff coefficient C for the whole catchment, but a real site is a mix of roofs, pavement, lawn and woods. This calculator answers the question: what single C represents that mix? It looks up C for each kind of cover from a table held in SMADA and averages them, weighted by area.
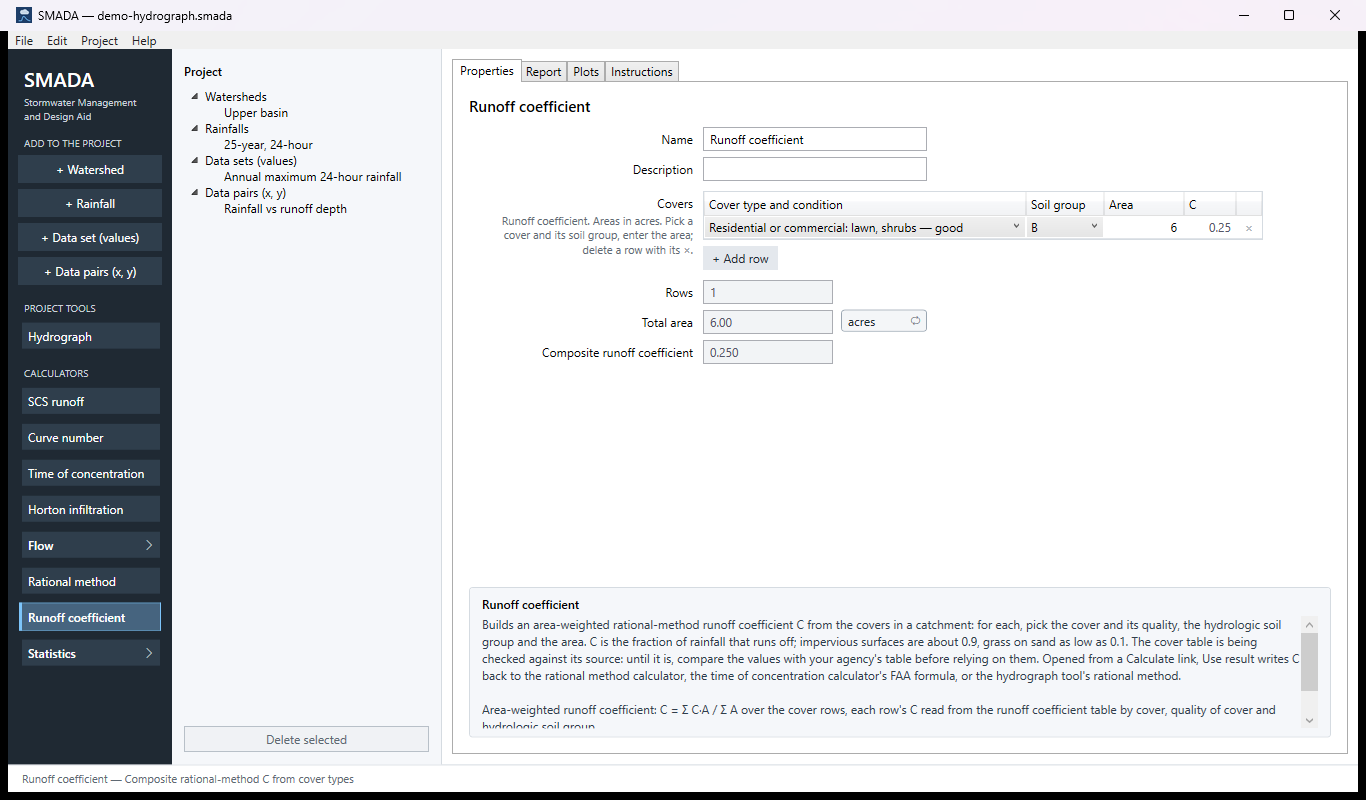
You enter one row per kind of cover in the Covers grid: pick the cover and its quality (poor, fair or good where the table distinguishes one), the hydrologic Soil group A to D, and type the Area. The grid shows the C each row takes from the table. You get back the Composite runoff coefficient, along with Rows (how many rows contribute) and their Total area, so you can check it against the catchment area. The composite stays blank until every row has a cover and an area greater than zero. Add a row with the button under the grid; remove a row with its × (Edit ▸ Undo brings it back).
Be careful with the table itself. It is being checked against its source: in the table as SMADA holds it, C falls from soil group A to D and good cover gives more runoff than poor, the opposite of most published tables, and a corrected table is expected. Until it arrives, compare each value with your agency's table before you rely on it.
The calculator is reached from the Calculate link beside every runoff coefficient in SMADA: on the Rational method calculator, on the Time of concentration calculator (the FAA formula uses C), and on the Hydrograph tool when its method is the rational method. Opened that way, Use result writes the composite back; it is unavailable while the composite is blank. It is the rational-method counterpart of the Curve number calculator; the two tables are not interchangeable.
The Runoff coefficient tabs
Every item in SMADA has the same four tabs. These are captured from the program with the example values it opens with; select a picture to see it full size.
Runoff coefficient has nothing to draw, so its Plots tab is empty and is not shown.
Properties tab — where you enter values and read the results
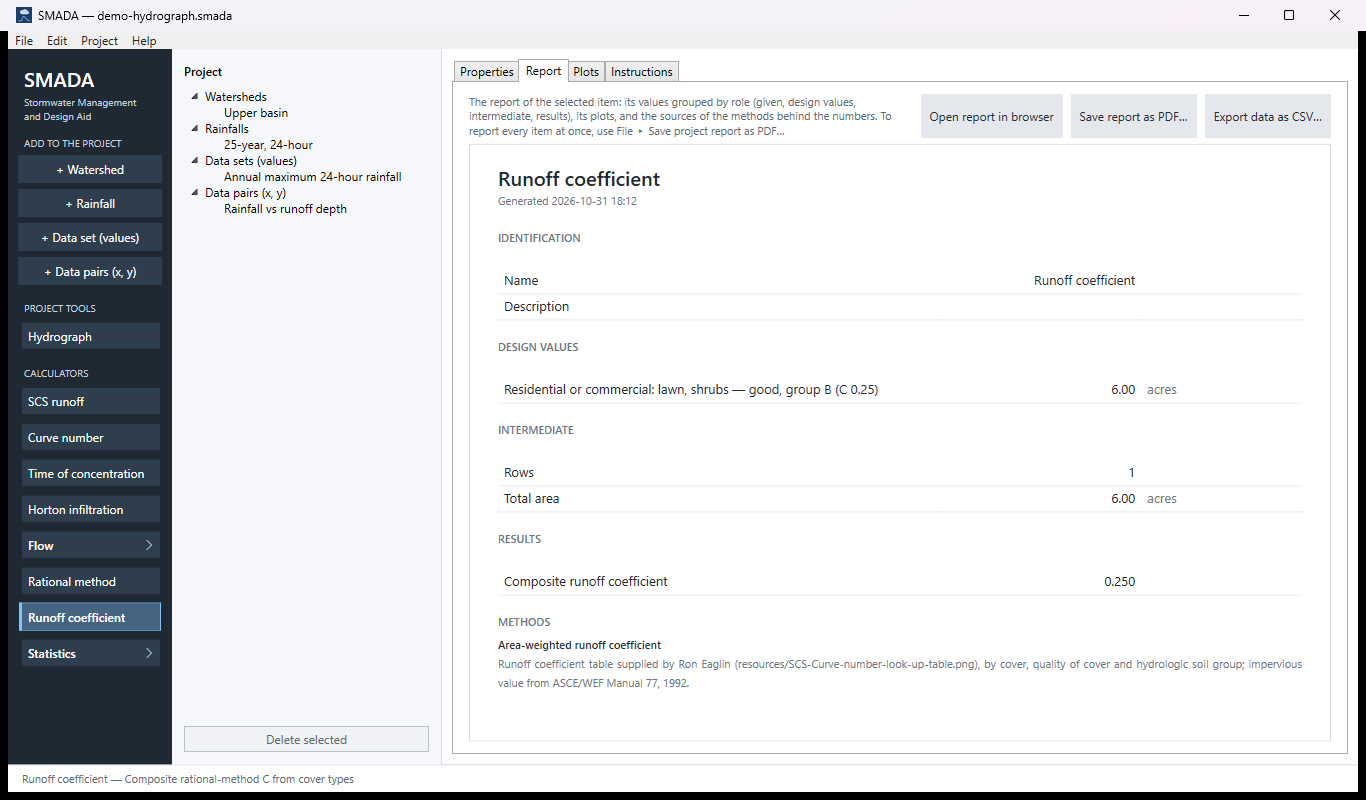
Report tab — the same values as a report, ready for HTML, PDF or CSV
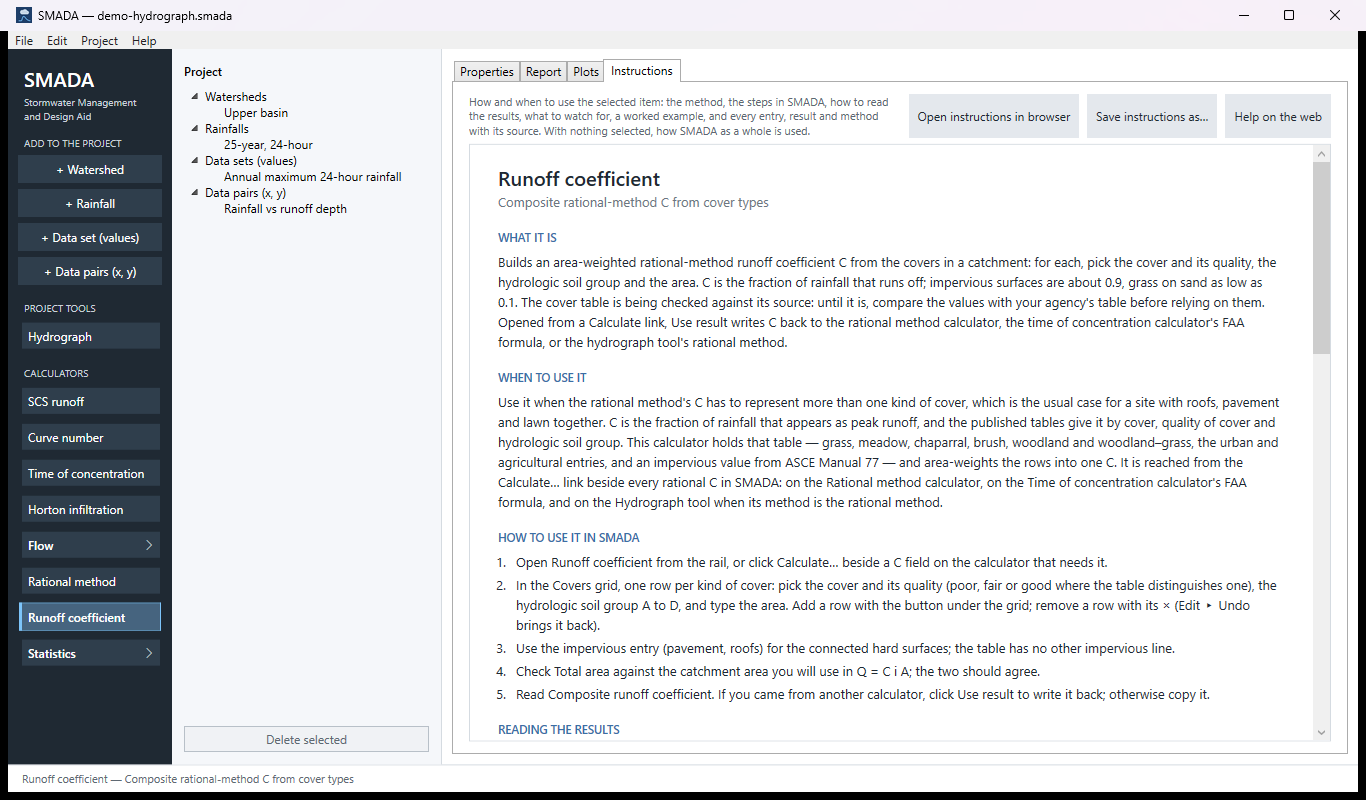
Instructions tab — the manual page in the program
How it calculates
Looking up each row
Each row in the Covers grid names a cover (with its quality where the table has one), a hydrologic soil group A to D, and an area. SMADA finds the cover in its runoff coefficient table and takes the value in that soil group's column. That value is shown in the grid's C column. A row whose cover is not in the table has no value.
Soil groups: A, sands and gravels (high infiltration); B, silt loam and loam (moderate); C, sandy clay loam (slow); D, clays and high water tables (very slow). The county soil survey (Web Soil Survey) gives the group for each soil.
The composite
The composite is the area-weighted average over the rows. It is computed only when every row is whole, that is, has both a cover found in the table and a positive area:
Ccomposite = Σ (Cj Aj) / Σ Aj
- Ccomposite
- composite runoff coefficient, dimensionless
- Cj
- table value for row j's cover, quality and soil group, dimensionless
- Aj
- area of row j, acres (any area unit gives the same ratio)
It is recalculated whenever a row is added, changed or removed. Along with it SMADA reports:
- Rows: how many rows contribute, that is, have a positive area and a cover found in the table.
- Total area: the sum of the areas of those same rows, the ones the composite weights; an unfinished row is not counted. Compare it with the catchment area you will use in the rational method, Q = 1.008 C i A.
Checks
- With no rows, the form asks you to add a row for each cover.
- A row with no cover chosen, a cover not in the table, or an area of zero or less is named in a note above the form, for example "Row 2: enter an area. The composite stays blank until every row has a cover and an area greater than zero." Only the first such problem is shown.
- While any row has a problem the composite is blank, so a half-finished grid never hands a number for the wrong catchment to another calculator. Rows and Total area still count the complete rows.
The table SMADA holds
This table is being checked against its source. In every row C falls from soil group A to D, and good cover gives more runoff than poor; most published runoff coefficient tables run the other way in both directions. SMADA copies the supplied table faithfully, and a corrected table is expected from the author. Until it arrives, the calculator's help says the same, and you should compare each value with the table your agency uses before relying on it.
Values of C by cover, quality of cover and hydrologic soil group, as they are held in SMADA. A dash means the table gives no quality for that cover.
| Group | Cover | Quality | A | B | C | D |
|---|---|---|---|---|---|---|
| Natural | Grass, annual or perennial | poor | 0.16 | 0.09 | 0.06 | 0.04 |
| Natural | Grass, annual or perennial | fair | 0.31 | 0.16 | 0.09 | 0.07 |
| Natural | Grass, annual or perennial | good | 0.41 | 0.22 | 0.12 | 0.09 |
| Natural | Meadow: seasonally high water table, sod-forming grass | poor | 0.20 | 0.11 | 0.06 | 0.05 |
| Natural | Meadow: seasonally high water table, sod-forming grass | fair | 0.30 | 0.15 | 0.09 | 0.07 |
| Natural | Meadow: seasonally high water table, sod-forming grass | good | 0.50 | 0.24 | 0.17 | 0.14 |
| Natural | Chaparral, broadleaf (manzanita, scrub oak) | poor | 0.28 | 0.15 | 0.09 | 0.06 |
| Natural | Chaparral, broadleaf (manzanita, scrub oak) | fair | 0.40 | 0.20 | 0.12 | 0.08 |
| Natural | Chaparral, broadleaf (manzanita, scrub oak) | good | 0.49 | 0.25 | 0.14 | 0.10 |
| Natural | Open brush: soft-wood shrubs, buckwheat, sage | poor | 0.21 | 0.11 | 0.07 | 0.05 |
| Natural | Open brush: soft-wood shrubs, buckwheat, sage | fair | 0.34 | 0.18 | 0.11 | 0.07 |
| Natural | Open brush: soft-wood shrubs, buckwheat, sage | good | 0.39 | 0.20 | 0.12 | 0.08 |
| Natural | Woodland: coniferous or broadleaf, canopy at least 50 % | poor | 0.35 | 0.18 | 0.11 | 0.07 |
| Natural | Woodland: coniferous or broadleaf, canopy at least 50 % | fair | 0.44 | 0.22 | 0.13 | 0.09 |
| Natural | Woodland: coniferous or broadleaf, canopy at least 50 % | good | 0.53 | 0.26 | 0.15 | 0.11 |
| Natural | Woodland–grass: canopy 20 % to 50 % | poor | 0.25 | 0.13 | 0.08 | 0.06 |
| Natural | Woodland–grass: canopy 20 % to 50 % | fair | 0.36 | 0.18 | 0.11 | 0.08 |
| Natural | Woodland–grass: canopy 20 % to 50 % | good | 0.47 | 0.24 | 0.14 | 0.09 |
| Urban | Residential or commercial: lawn, shrubs | good | 0.48 | 0.25 | 0.16 | 0.12 |
| Urban | Open space: grass cover < 50 % | – | 0.26 | 0.09 | 0.06 | 0.04 |
| Urban | Open space: grass cover 50 % to 75 % | – | 0.31 | 0.16 | 0.09 | 0.07 |
| Urban | Open space: grass cover > 75 % | – | 0.41 | 0.22 | 0.12 | 0.09 |
| Urban | Impervious: pavement, roofs | – | 0.90 | 0.90 | 0.90 | 0.90 |
| Agricultural | Fallow: plowed, not tilled or seeded | poor | 0.16 | 0.09 | 0.06 | 0.04 |
| Agricultural | Fallow: plowed, not tilled or seeded | fair | 0.31 | 0.16 | 0.09 | 0.07 |
| Agricultural | Fallow: plowed, not tilled or seeded | good | 0.41 | 0.22 | 0.12 | 0.09 |
| Agricultural | Pasture, dry land (annual grasses) | – | 0.41 | 0.22 | 0.12 | 0.09 |
| Agricultural | Pasture, irrigated (legumes, perennial grass) | poor | 0.24 | 0.12 | 0.07 | 0.05 |
| Agricultural | Pasture, irrigated (legumes, perennial grass) | fair | 0.36 | 0.18 | 0.11 | 0.08 |
Notes on the table:
- The impervious line (pavement, roofs, 0.90 for every soil group) is not in the source table; it is taken from ASCE Manual 77, which gives 0.70 to 0.95.
- The dry-land pasture line was read from the source image and repeats the fallow (good) values; confirm it before relying on it. Irrigated pasture in good condition is cut off in the source and is not in the table.
- The values are for the frequent storms the rational method was built for. No frequency factor for rarer storms is applied.
Checking the example by hand
The calculator opens with one row: residential or commercial lawn and shrubs, good, soil group B, 6 acres. The table gives C = 0.25, so Rows is 1, Total area 6.00 acres and the composite 0.25 × 6 / 6 = 0.250. Add 2 acres of impervious pavement and roofs (0.90):
Ccomposite = (0.25 × 6 + 0.90 × 2) / (6 + 2) = 3.3 / 8 = 0.4125
Sources
- Runoff coefficient table supplied by Ron Eaglin, by cover, quality of cover and hydrologic soil group (being checked against its source; see above). The report names this source under Methods.
- Impervious value: ASCE/WEF Manual 77, 1992.
All SMADA calculators · Get SMADA free for Windows from the Microsoft Store