SCS runoff
Runoff depth, potential retention, initial abstraction and losses from a storm's total rainfall depth and an SCS curve number.
What it is for
How much of a storm runs off, and how much is held by the soil and cover? The SCS runoff calculator answers that with the SCS (NRCS) curve-number relation: one total rainfall depth and one number that describes the soil and land cover give the depth of direct runoff over the area.
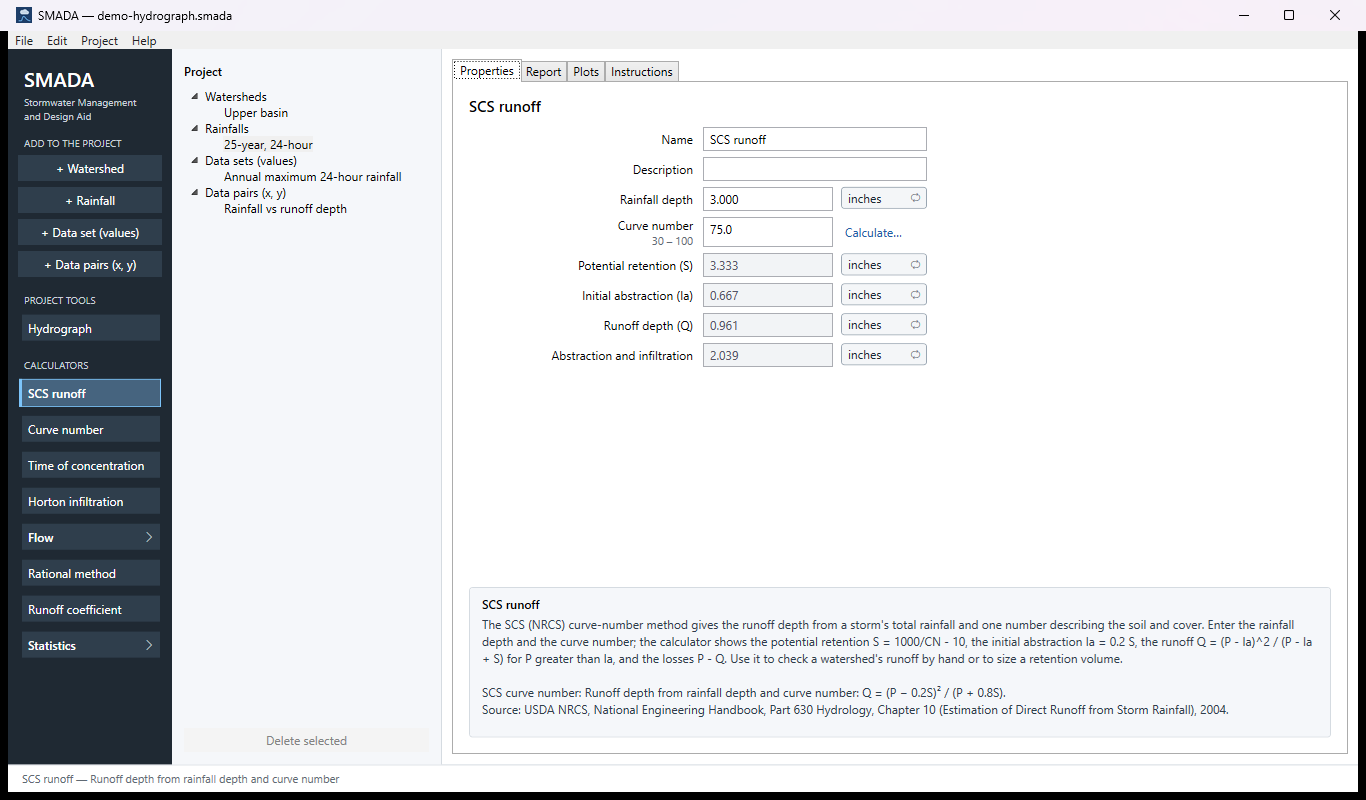
You enter the rainfall depth of the design storm, from the rainfall frequency atlas for the return period and duration, and the curve number, 30 to 100. A curve number below 30 is computed with a warning; zero or less, or above 100, leaves the results blank with a note saying why. SMADA shows the potential retention S, the initial abstraction Ia, the runoff depth Q, and the depth lost to abstraction and infiltration, P − Q. The results update as you type. Multiply the runoff depth by the drainage area for a runoff volume.
If the watershed has mixed cover, click Calculate… beside the curve number to open the Curve number calculator, build an area-weighted value from TR-55 Table 2-2, and bring it back with Use result. The same relation is what a watershed applies, step by step, to the part of its area that is not directly connected impervious when its loss method is Curve number; use this calculator for a depth and a volume, and the Hydrograph tool when you need a peak and its timing.
The SCS runoff tabs
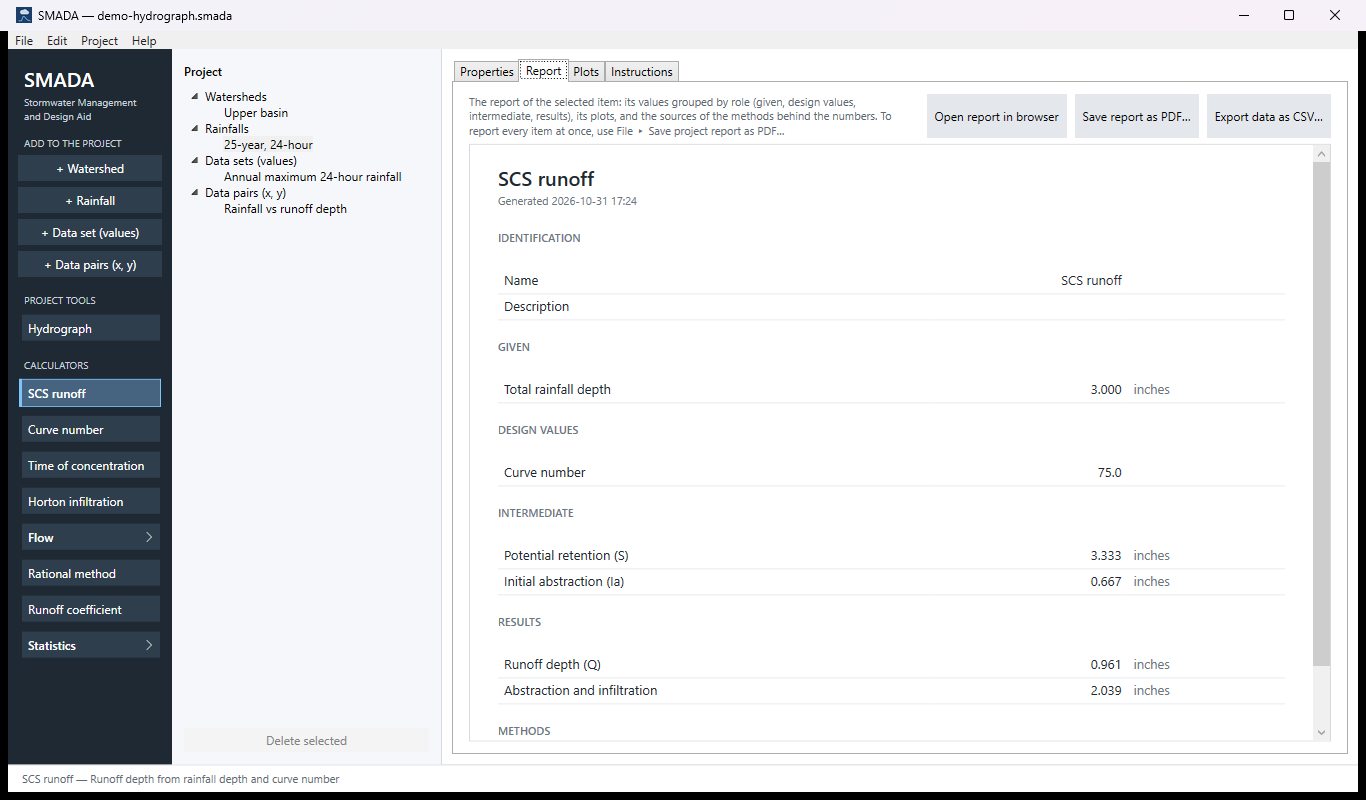
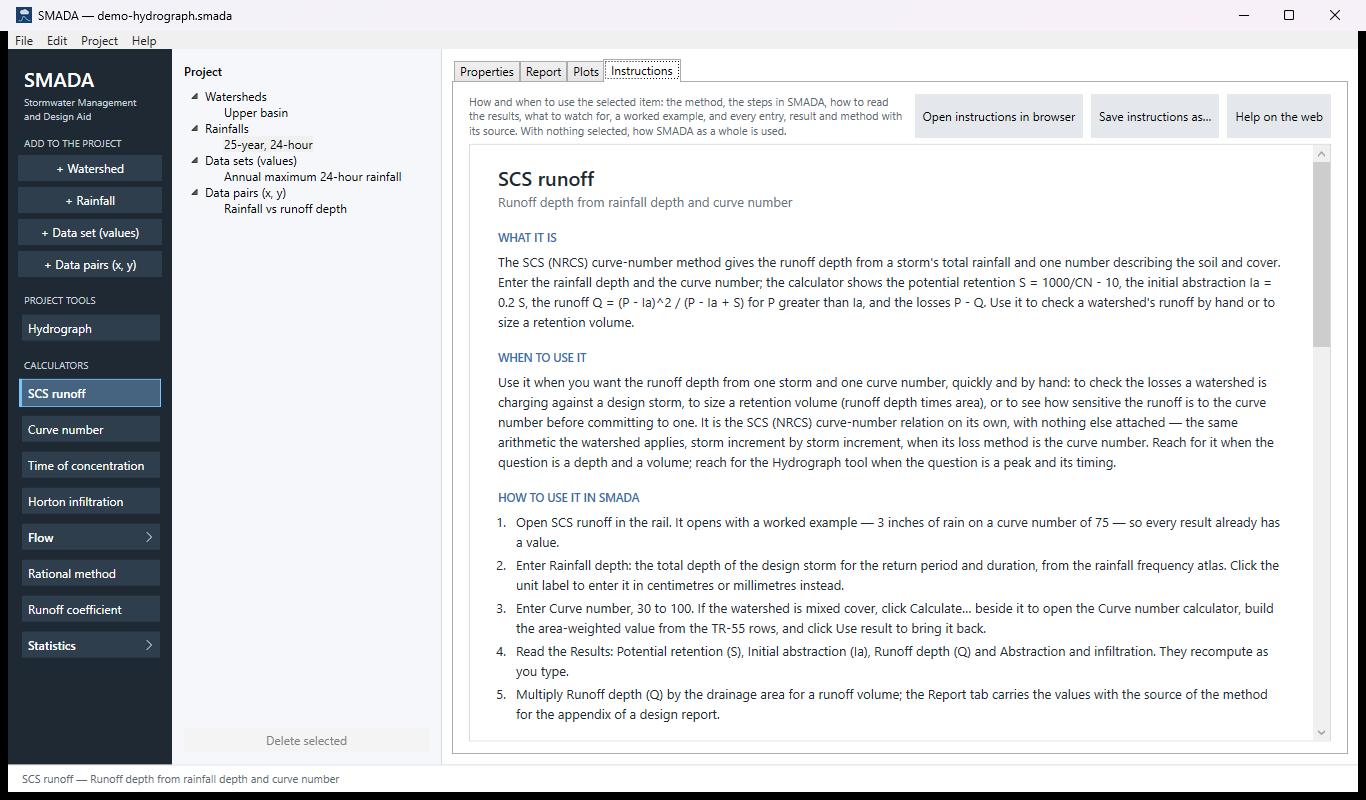
Every item in SMADA has the same four tabs. These are captured from the program with the example values it opens with; select a picture to see it full size.
SCS runoff has nothing to draw, so its Plots tab is empty and is not shown.
Properties tab — where you enter values and read the results
Report tab — the same values as a report, ready for HTML, PDF or CSV
Instructions tab — the manual page in the program
How it calculates
The calculator applies one method, the SCS curve number, in closed form. All depths are in inches. There is nothing to iterate: each result follows directly from the two inputs, in this order.
1. Potential maximum retention
S = 1000 / CN − 10
- S
- potential maximum retention after runoff begins, in
- CN
- runoff curve number, dimensionless (30 to 100)
A curve number of 100 gives S = 0, so all rain runs off. S grows quickly as CN falls: CN 75 gives 3.333 in, CN 50 gives 10 in.
2. Initial abstraction
Ia = 0.2 S
- Ia
- initial abstraction: interception, depression storage and early infiltration before any runoff, in
The ratio 0.2 is fixed in the code as the standard value. Current practice sometimes uses 0.05 with a converted curve number; SMADA does not, so do not use curve numbers published for the 0.05 ratio here.
3. Runoff depth
Q = (P − Ia)2 / (P + 0.8 S) for P > Ia
Q = 0 for P ≤ Ia
- Q
- direct runoff depth over the area, in
- P
- total rainfall depth of the storm, in
- S
- potential maximum retention, in
- Ia
- initial abstraction, in
With Ia = 0.2 S the denominator P + 0.8 S is the same as P − Ia + S, the form shown in the help panel. The zero branch is needed because below Ia the squared term would otherwise give a positive runoff from a negative excess. A rainfall depth of zero or less gives Q = 0.
4. Abstraction and infiltration
L = max(P, 0) − Q
- L
- everything that did not run off: initial abstraction plus infiltration during the storm, in
Q and L always add up to the rainfall depth, which is a check on continuity.
The calculation check of 2026-10-15 reproduced TR-55 Table 2-1 (runoff depth, 247 cells, within its printed rounding), TR-55 Table 5-1 (Ia for CN 40 to 98) and NEH-630 Example 16-1.
Checks and limits
- The curve number field is marked 30 to 100. A value outside that range is kept as entered, never clamped, so a saved file keeps what was typed.
- A curve number below 30 is outside the tables the relation was built from. SMADA still computes the results and shows a warning above the form: under 30 almost no ordinary storm runs off.
- A curve number of zero or less, or above 100, has no meaning (S would be infinite or negative). The four results are left blank, shown as a dash, and a note says to enter a value from 30 to 100.
- The relation is for antecedent runoff condition II, average soil moisture; the calculator makes no adjustment for wet or dry conditions.
- Depths are stored in inches. Click a unit label to enter or read them in centimetres or millimetres; the arithmetic above is done in inches either way.
- Q is a depth spread over the whole drainage area. For a volume, multiply by the area: inches × acres / 12 gives acre-feet.
Checking the example by hand
The calculator opens with P = 3 in and CN = 75:
- S = 1000 / 75 − 10 = 3.333 in
- Ia = 0.2 × 3.333 = 0.667 in
- Q = (3 − 0.667)2 / (3 + 0.8 × 3.333) = 5.444 / 5.667 = 0.961 in
- L = 3 − 0.961 = 2.039 in
With CN = 90 instead, S falls to 1.111 in and Q rises to 1.984 in, more than double.
Sources
- USDA NRCS, National Engineering Handbook, Part 630 Hydrology, Chapter 10 (Estimation of Direct Runoff from Storm Rainfall), 2004.
All SMADA calculators · Get SMADA free for Windows from the Microsoft Store