ANOVA
One-way ANOVA (Module 14)
Three or more groups — alloys, suppliers, machines — and one question: do they share a mean? Use it instead of many two-sample tests, which would raise the chance of a false finding; then Tukey's HSD says which pairs differ.
- Choose the Data table and the Layout: Each column is a group, or A factor column and a response column (level codes 1, 2, 3 … beside the measurements).
- For columns as groups, name the Group columns or leave blank to use them all; otherwise choose the Factor column and Response column.
- Significance level (α), usually 0.05.
- Read the Group summaries, the ANOVA table (SS, df, MS), F with its critical value, the p-value, the Decision, η² and the power.
- If F is significant, read Tukey HSD pairs — each pair with its difference, interval and adjusted p — and Pairs that differ.
- Check the assumptions: Bartlett and Levene (equal variances), Shapiro–Wilk of the residuals, and Kruskal–Wallis as the fallback.
Reading it: a small p says at least one mean differs — no more. η² is the share of variation the groups explain. Tukey's intervals hold for all pairs together; a pair whose interval leaves out zero differs. If Levene's p is below 0.05 or the residuals are clearly not normal, report Kruskal–Wallis instead.
Watch out: groups may differ in size (the Tukey–Kramer form is used automatically). Bartlett can fail just because the data are not normal; Levene is the robust check. The power shown is for the effect observed, after the fact.
Plots: every group as a box plot, the group means with confidence intervals, and the residual Q–Q plot.
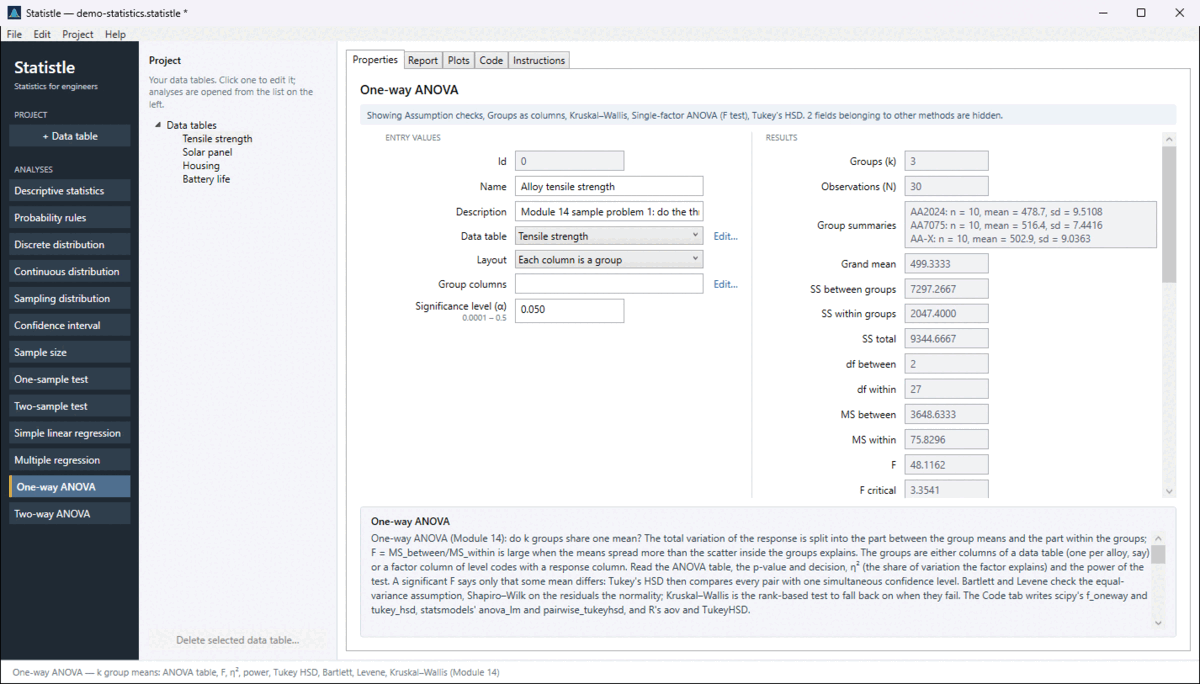
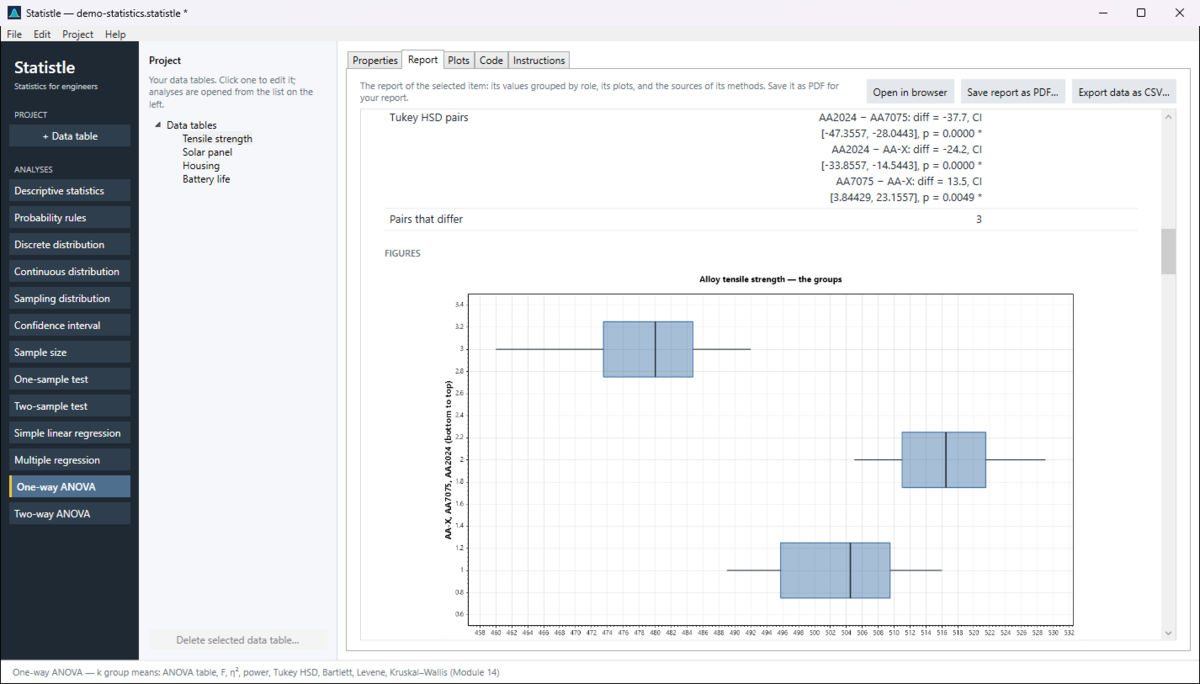
Example: the sample project's Tensile strength table (the course's Module 14 sample problem): F = 48.1, p = 1.3 × 10⁻⁹, η² = 0.78; Tukey finds all three pairs different.
Two-way ANOVA (Module 14)
Two factors varied together in a balanced experiment — every combination of levels measured the same number of times. It says whether each factor matters and, above all, whether they interact.
- Lay the data out one row per observation: a column of level codes for factor A, one for factor B, and the response.
- Choose the Data table, Factor A column, Factor B column, Response column and Significance level (α).
- Read the Cell means and the ANOVA table: SS, df, MS, F and p for A, for B and for the interaction, each with a decision.
Reading it: read the interaction first. If it is significant, the lines of the interaction plot are not parallel: the effect of A depends on B, so read the cell means together. If not, each main effect stands on its own.
Watch out: an unbalanced table is reported, not fitted. With one observation per cell the interaction cannot be tested; the form says so and fits the additive model.
Plots: the interaction plot (one line per level of B across the levels of A) and the residual Q–Q plot.
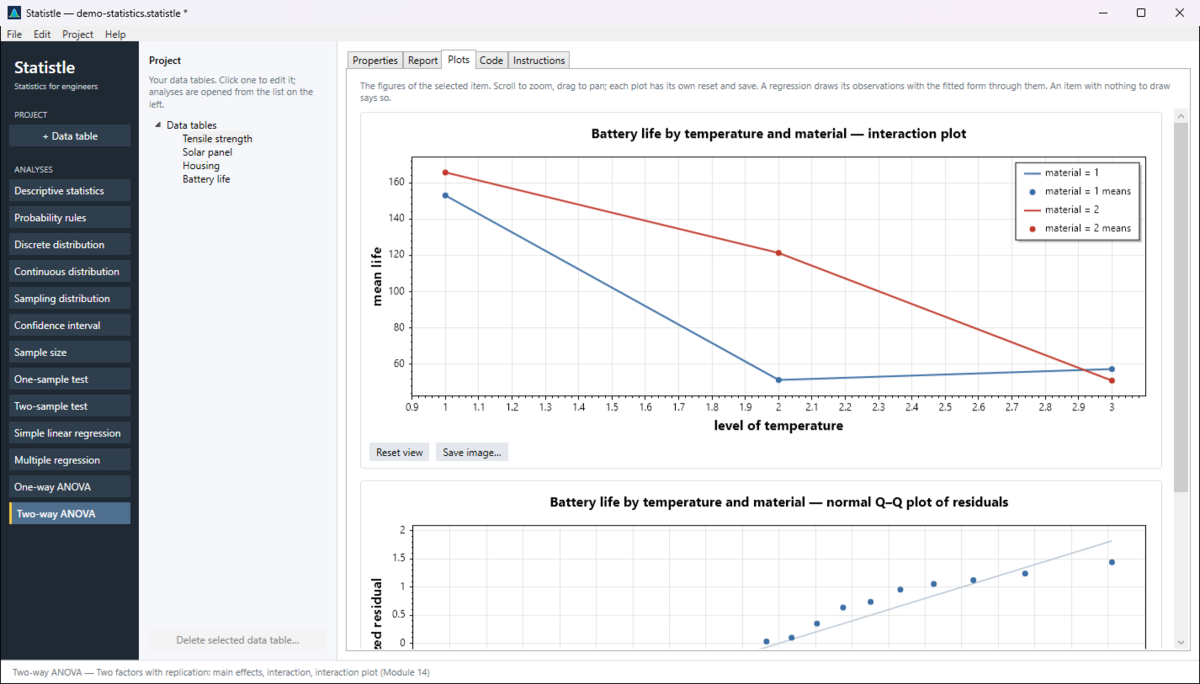
Example: the sample project's Battery life table — temperature at three levels, material at two, three batteries per cell; the interaction is significant at 0.05.
Where the formulas come from
EGN3443 Module 14; Montgomery and Runger, Applied Statistics and Probability for Engineers, 7th ed., Chapters 13 and 14. The Instructions tab and the Report tab name the source of every method in use, and the help panel shows it when you click a field. The Code tab writes the same calculation in Python and R, formula first.