Statistle help
These pages describe Statistle 1.1.0. Until 1.1 reaches the Microsoft Store, the Store installs 1.0.0, which does not yet have: the Help menu (Help for this screen, Help on the web, Check for a new version, About), the question "Save changes … ?" before a new project, another project or closing, the offer to restore unsaved work, File ▸ Open the sample project and the start panel, the red notes that say why a value was not used, the preview when you import a whole table, and the question before a table is deleted. Some names differ in 1.0.0 too: "Save as PDF…" for Save report as PDF…, "Copy" and "Save as…" for Copy code and Save code as…, and "Delete selected" for Delete selected data table…. Help ▸ About shows which version you have.
Statistle is free statistics software for students. It follows Dr. Ron Eaglin's course EGN3443, Probability and Statistics for Engineers, module by module, from descriptive statistics to two-way ANOVA. You put your numbers in a data table, choose an analysis from the list on the left, and Statistle computes the result — and explains every input and every number, says where each formula comes from, and writes the Python and R that give the same answers.
It is meant for students learning statistics and the instructors who teach them. It is a calculator and a study aid, not a grader: it does not tell you whether an assignment answer is right.
Your first analysis, step by step
Statistle comes with a sample project, demo-statistics.statistle, with data already in it. It is the easiest way to see how everything works, and you cannot break it: Statistle keeps it in your Documents\Statistle folder and puts a fresh copy back if it is ever deleted.
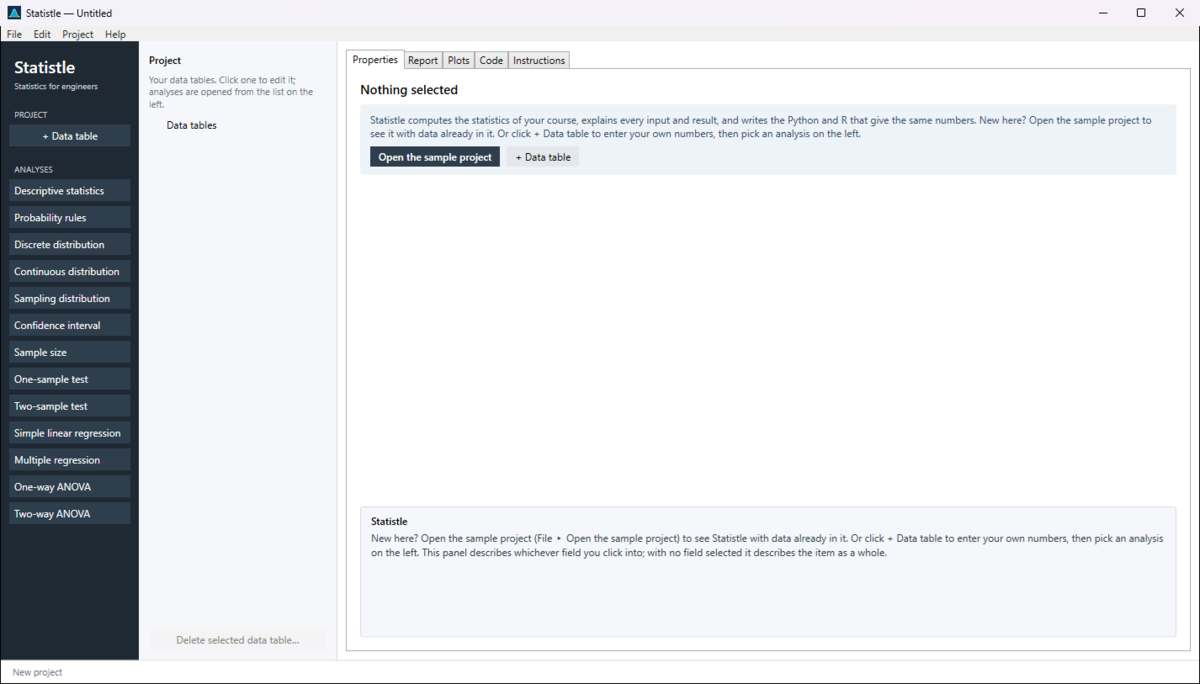
- Open Statistle from the Start menu. It starts with an empty project called "Untitled". The right-hand side shows a blue panel that says what Statistle is for, with two buttons.
- Click Open the sample project in that panel (or choose File ▸ Open the sample project).
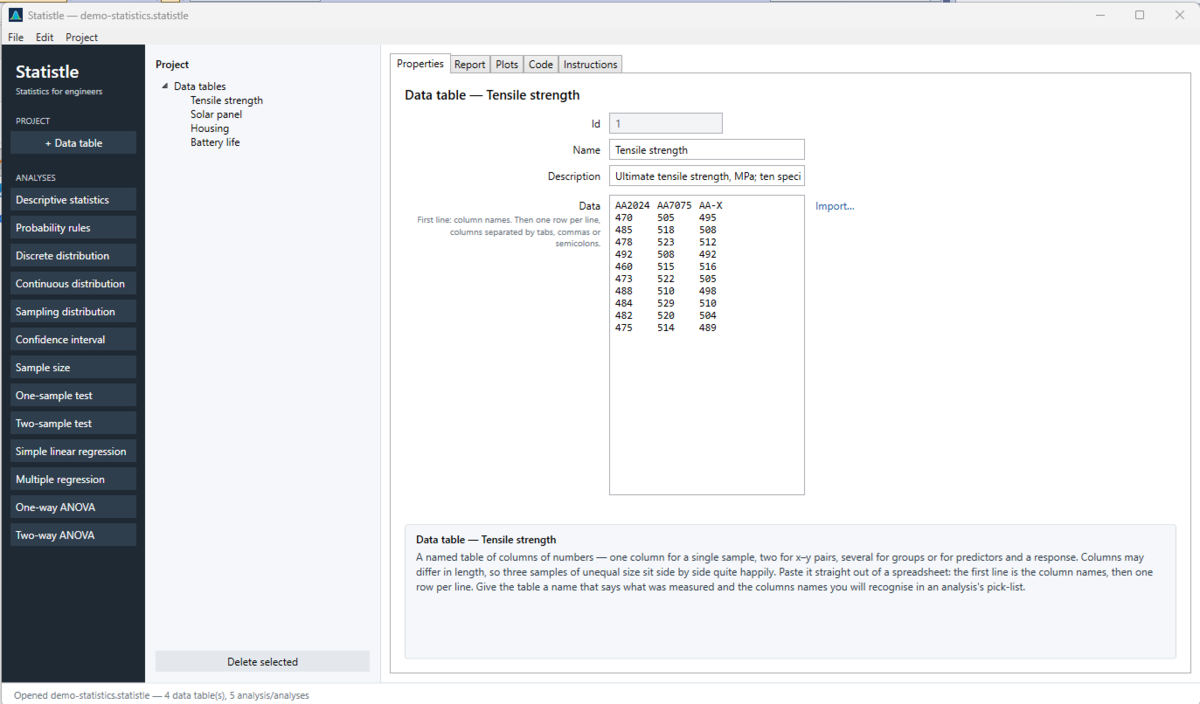
- The Project list in the middle now shows four data tables: Tensile strength, Solar panel, Housing and Battery life. Click Tensile strength. The Properties tab shows its numbers: three columns, AA2024, AA7075 and AA-X, ten strength measurements each.
- In the dark list on the left, under ANALYSES, click Descriptive statistics. Its button lights up, and the form opens with the entries on the left (ENTRY VALUES) and the answers on the right (RESULTS). In the sample project it is already reading the column Tensile strength › AA2024.
- Read the results: the mean is about 478.7 MPa and the standard deviation about 9.5 MPa. Click any result — Skewness, say — and the panel at the bottom explains what it means and how it is computed.
- Change the Column drop-down to AA7075. Every result changes at once; there is no Calculate button.
- Click the Plots tab for the histogram and the box plot, then the Code tab for the Python that gives the same numbers. Click R to see the same in R.
- To try it on your own numbers, see Data tables. Not sure what something does? Rest the mouse on it: every button, menu item, tab and box has a tip that says.
The help pages
- The window — the list of analyses, the project list, the five tabs, the help panel and the menus.
- Data tables — typing, pasting from a spreadsheet, importing a CSV or Excel file with a preview, deleting a table, and getting the data back out.
- The analyses — which one answers which question, with a page for each group: descriptive statistics, probability and distributions, confidence intervals and sample size, hypothesis tests, regression and ANOVA.
- The Code tab: Python and R — what it writes, and how to run it in Google Colab, Python or R.
- Projects, files and reports — saving, opening, the "Save changes?" question, getting unsaved work back, undo, and reports as PDF or HTML.
- The Help menu — help for the screen you are on, help on the web, checking for a new version, and About.
- Messages you may see — the red notes, the questions Statistle asks, and what to do about each.
Words used here
- Project — one Statistle file (
.statistle) holding your data tables and the analyses you have set up. - Data table — named columns of numbers. Columns may have different lengths.
- Analysis — a calculation from the course, such as One-sample test or One-way ANOVA. Each one is a form: entries in, results out.
- The rail — the dark list down the left side of the window, with + Data table and the analyses.
- The help panel — the box under the form that explains whatever you clicked.
Inside the program, the Instructions tab has a full page for each analysis and for data tables: when to use it, the steps, how to read the results, what to watch for, a worked example, and every entry and result with its source. Press F1 anywhere to open it; its link More on the web leads to the matching page here.