The Code tab: Python and R
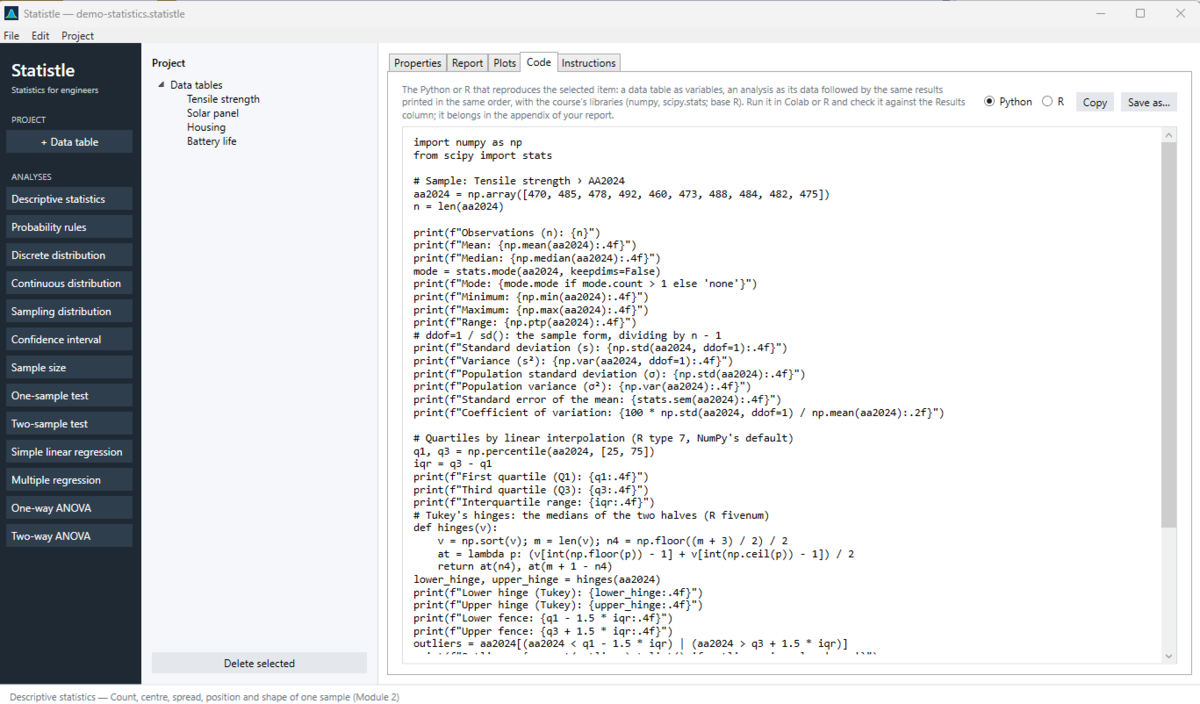
The Code tab writes a script that reproduces whatever is selected, in Python or R — choose with the buttons at the top right. Run it and you get the same numbers Statistle shows, so you can check the work and put the code in your report's appendix.
What it writes
- For a data table: each column as a variable (a numpy array in Python, a vector in R), named after the column, and — when the columns are the same length — a pandas DataFrame or an R data.frame.
- For an analysis: the data, then the calculation — by the formula first, and where there is one, the library call as a check — then a
printof every result, labelled exactly as on the form (for exampleMean: 478.7000), in the same order as the Results column. - Comments say where Python and R conventions differ — for example dividing by n − 1 (
ddof=1), quartile type 7, or the exponential's scale = 1/λ in scipy.
Copy code puts the script on the clipboard. Save code as… saves it as a .py (Python) or .R file. Both are grey until a data table or an analysis is selected, and both first take any value you are still typing in a box, so the code matches what you see.
The Python uses the course's libraries: numpy, scipy.stats, and for some analyses pandas and statsmodels. The R uses base R only — nothing to install.
Run the Python in Google Colab (easiest)
- Click Copy code in Statistle's Code tab (with Python chosen).
- Go to colab.research.google.com, sign in with a Google account and choose New notebook.
- Click into the first cell, paste (Ctrl+V) and press Shift+Enter to run it. Colab already has numpy, scipy, pandas and statsmodels.
- Compare the printed lines with the Results column in Statistle.
Run the Python on your own computer
- Install Python from python.org if you do not have it.
- Install the libraries once, in a Command Prompt:
pip install numpy scipy pandas statsmodels(a recent SciPy is needed — 1.11 or later). - In Statistle, click Save code as… and save the script, for example
tensile.py. - In the Command Prompt, go to that folder and run
python tensile.py. Or open the file in a notebook or editor such as Jupyter or VS Code and run it there.
Run the R
- Install R from cran.r-project.org (and, if you like, RStudio).
- Choose R in Statistle's Code tab. Either Copy code and paste into the R console, or Save code as… a
.Rfile and run it withsource("tensile.R")in R (or Source in RStudio), orRscript tensile.Rin a Command Prompt.
If the numbers do not match
- Statistle rounds on screen; the script prints a set number of decimals. Compare to the decimals shown.
- Make sure you copied the code after your last change: the Code tab follows every edit, but a script saved earlier does not.
- A Python error such as
ModuleNotFoundErrormeans a library is missing — run thepip installline above. An error abouttukey_hsdorstudentized_rangemeans your SciPy is too old.
An item with nothing to write says "… has no code to show." With nothing selected the tab says "Select a data table or an analysis to see its code."