Data tables
Every analysis that works on measurements reads them from a data table: named columns of numbers. Enter a data set once, and every analysis that uses it follows when you change it.
- One column is a sample (descriptive statistics, a one-sample test).
- Two columns are two samples or x–y pairs (two-sample tests, simple regression).
- Several columns are groups (one-way ANOVA) or predictors and a response (multiple regression).
- Columns of level codes beside a response column are the "stacked" layout used by one-way and two-way ANOVA.
Make a table
- Click + Data table at the top of the rail (or Project ▸ Add data table, or the + Data table button in the start panel of a new project). A table called "Data table 1" (2, 3 …) appears in the project list and opens.
- Type a Name that says what was measured — it is how you will find the table in an analysis's drop-down. Use Description for notes: where the numbers came from, the units, which assignment. Press Enter or Tab to keep what you typed.
- Put the numbers in the Data box (next section), or click Import… beside it.
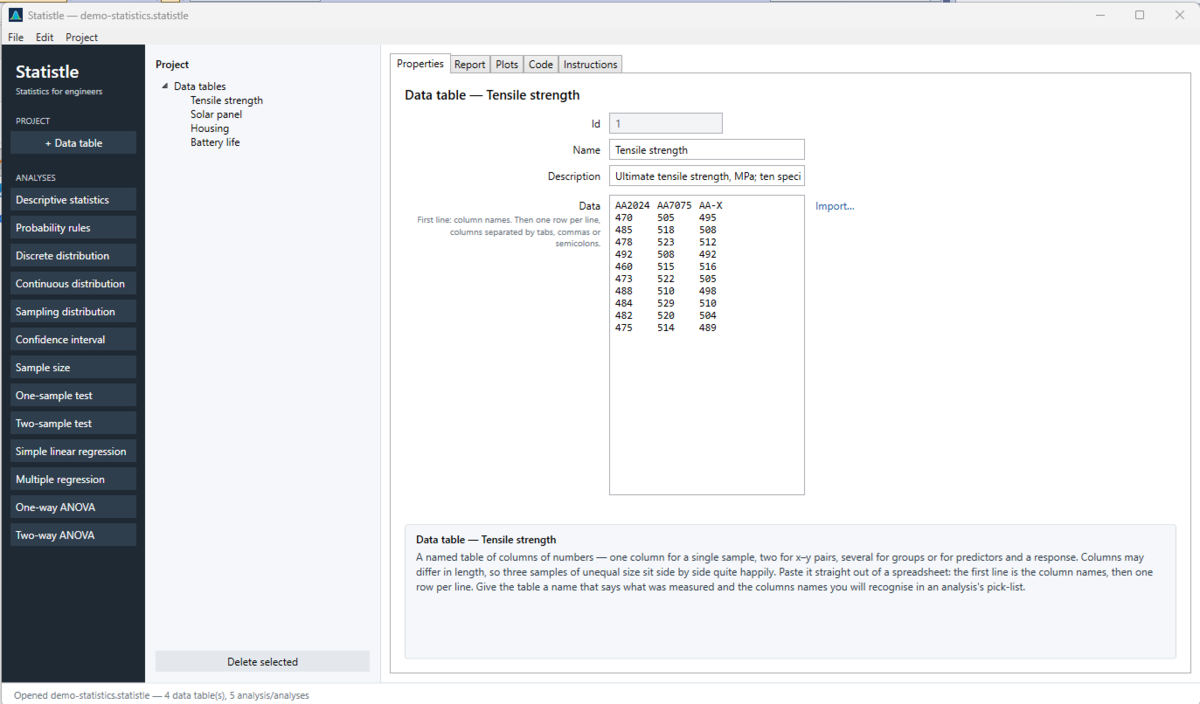
Type or paste the numbers
The Data box is plain text:
- The first line is the column names. It is required — without it, your first row of numbers becomes the column names.
- Then one row per line, with the cells separated by tabs, commas or semicolons. Copying cells from Excel or Google Sheets and pasting them in gives exactly this.
- Columns may be different lengths: leave the cell blank where a column has no value. Blank means missing, not zero — never type 0 for a missing value.
- Numbers only. A cell that is neither blank nor a number (a unit, a note, a typo) means the whole paste is not used: the box turns red, the table keeps the data it had, and a red note under the box names the line and the column, for example "Line 4, column 'AA2024': '492 MPa' is not a number. The paste was not used; your earlier data is kept. Correct that cell, or press Esc to go back to the data in use." Put units in the column name instead, for example
Strength MPa. - Factor levels (for ANOVA) must be number codes — 1, 2, 3 — because a table holds numbers only. Write what each code means in the Description.
The Data box takes what you typed when you click somewhere else or press Tab (Enter starts a new line there). Esc puts back the data in use. To check a paste worked, click into the Data box: the help panel at the bottom ends with how much the table holds, for example "This table holds 3 columns, 10 rows."
For example, a table with two samples of different sizes:
Before,After
12.1,11.4
13.0,12.2
12.6,
Import a file, with a preview
- Click Import… beside the Data box and choose a file. Statistle reads CSV and text files (.csv, .txt, .dat, .prn), Excel workbooks (.xlsx) and DISTRIB .xd2 files.
- The Import into Data window shows the first 40 rows of the file. For a workbook with several sheets, choose the one you want in Sheet; the preview changes to show it.
- Read the line at the bottom left before you go on. It says what will happen, for example "3 columns will be imported (2 columns with no numbers left out), replacing the 3 columns the table has now. Edit ▸ Undo (Ctrl+Z) puts the old data back." Every column that holds numbers becomes a column of the table; the header row gives the column names; cells that are not numbers are skipped; columns with no numbers at all (labels, notes) are left out.
- Click Import, or Cancel (Esc) to change nothing. Press F1 in this window to open this page.
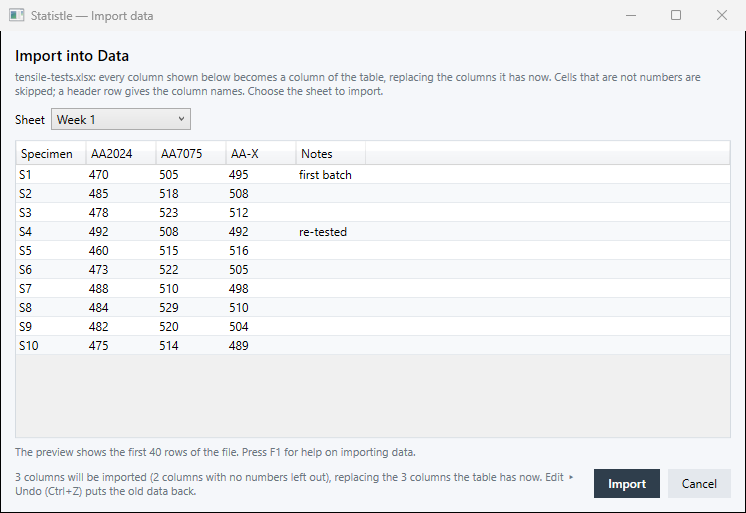
Importing into a table replaces every column it has. The status line then says, for example, "Imported 3 columns from tensile-tests.xlsx, sheet 'Week 1'. Edit ▸ Undo (Ctrl+Z) puts the old data back."
The old Excel format .xls is not read: open it in Excel, save it as .xlsx or .csv, and import that.
Some analyses also let you type values straight into the analysis (for example Sample in Descriptive statistics, or Data (x, y) in Simple linear regression). Those boxes have their own Import…: the same window, where you choose the sheet and the Value column (or the x column and y column), and it says how many values or pairs will be imported. They replace what the box holds; Ctrl+Z puts it back.
Use the table in an analysis
Open an analysis from the rail and pick the column in its drop-down. Columns are listed as Table › Column, for example Tensile strength › AA2024. The analysis copies the values (shown grey and locked) and recalculates whenever the table changes. Edit… beside the field takes you to the table. Analyses that need several columns (multiple regression, ANOVA) ask for the Data table first, then the columns.
If the project has no table yet, an analysis that needs one says: "This analysis reads a data table, and the project has none yet. Click + Data table on the left, paste or Import your data, then come back and choose it here."
If you rename or delete a column an analysis uses, the analysis says so and keeps its last copy of the values.
Choosing Entered below in a column drop-down lets you type the values into the analysis itself instead.
Delete a table
- Click the table in the project list.
- Click Delete selected data table… under the list (or Project ▸ Delete selected data table…).
- Statistle asks "Delete the data table '…'? Analyses that read from it keep the values they last copied. Edit ▸ Undo (Ctrl+Z) brings it back." No is the default; click Yes to delete it.
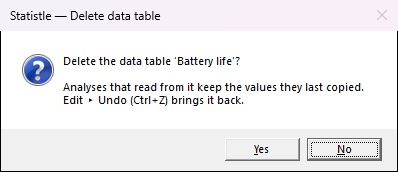
An analysis that read from a deleted table says "The data table this analysis read from has been deleted, so the values shown are the ones last copied from it. Choose another column, or press Ctrl+Z to bring the table back." Analyses themselves cannot be deleted — each project has one of each, opened from the rail.
Get the data out
- Export data as CSV… (File menu, or the Report tab) writes the selected item's values to a .csv file that opens in Excel.
- The Code tab of a table writes each column as a Python numpy array and an R vector, plus a pandas DataFrame and an R data.frame when the columns are the same length — ready to paste above your own code.