The window
Statistle's window has three parts from left to right, with a menu bar across the top and a status line along the bottom. Rest the mouse on any button, menu item, tab or box and a tip says what it does; a greyed button's tip says what turns it on.
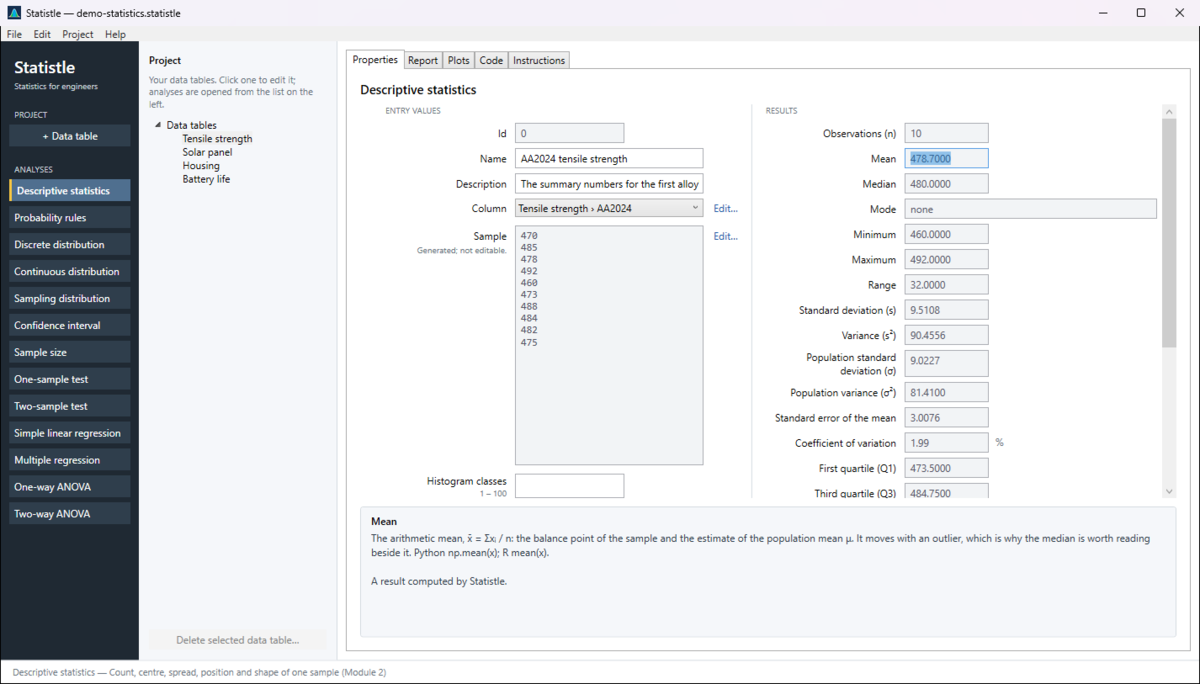
1. The rail (dark, on the left)
- + Data table (under PROJECT) adds a new, empty data table to the project and opens it.
- Under ANALYSES are the thirteen analyses in course order: Descriptive statistics, Probability rules, Discrete distribution, Continuous distribution, Sampling distribution, Confidence interval, Sample size, One-sample test, Two-sample test, Simple linear regression, Multiple regression, One-way ANOVA and Two-way ANOVA. Rest the mouse on one to see what it covers and which course module it belongs to. Click one to open it; its button stays lit (a lighter colour with a yellow bar) while it is open, so you can always see where you are. See The analyses.
Each project keeps one copy of each analysis. Whatever you set in it is saved with the project, and it is still there the next time you click it.
2. The project list (middle)
Under Project it says "Your data tables. Click one to edit it; analyses are opened from the list on the left." Data tables lists the tables in this project; click one to see and edit it. Analyses are not listed here — open them from the rail.
Delete selected data table…, at the bottom, deletes the table you selected. It asks first, and Edit ▸ Undo (Ctrl+Z) brings the table back. The button is grey while an analysis (or nothing) is selected, because only data tables can be deleted. See Data tables.
3. The tabs (right)
The tabs always show the item you selected last — a data table or an analysis. With nothing selected (a new project), the Properties tab shows a blue start panel: what Statistle is for, and the buttons Open the sample project and + Data table.
- Properties — the form. For an analysis: ENTRY VALUES on the left, RESULTS on the right. Results recompute as soon as a value is used. Type a value and press Enter or Tab (or click somewhere else) to use it; press Esc to put back the value in use. If Statistle cannot use what you typed, the box turns red and a red note under it says why and which value it is still using (see Messages). A grey, locked box is filled in by Statistle (for example, the values of a column you picked) and cannot be typed in. Where an analysis offers several ways to get the answer, the heading reads RESULTS — CLICK THE ONE TO USE: the chosen result is highlighted in yellow.
- Report — the same values grouped by role (given values, choices, intermediate values, results), with the plots and the sources of the methods. Buttons: Open in browser, Save report as PDF… and Export data as CSV…. See Projects, files and reports.
- Plots — every figure the item draws: histograms, box plots, distribution curves with the probability shaded, regression lines, residual plots and more. Scroll the mouse wheel to zoom and drag to move; each plot has Reset view and Save image… (a PNG file). An item with nothing to draw says so.
- Code — the Python or R that reproduces the item, with Copy code and Save code as…. See The Code tab.
- Instructions — a full page on the selected item: what it is, when to use it, how to use it in Statistle, reading the results, what to watch out for, a worked example, every entry and result, the methods and sources, the plots and the code. With nothing selected it describes Statistle as a whole. Open in browser shows it as a web page; Save instructions as… keeps it as a web page (.html) or plain text (.txt). The link More on the web: softwareplus.ai/statistle/help/… opens the page of this help about the selected item. Press F1 anywhere to come to this tab.
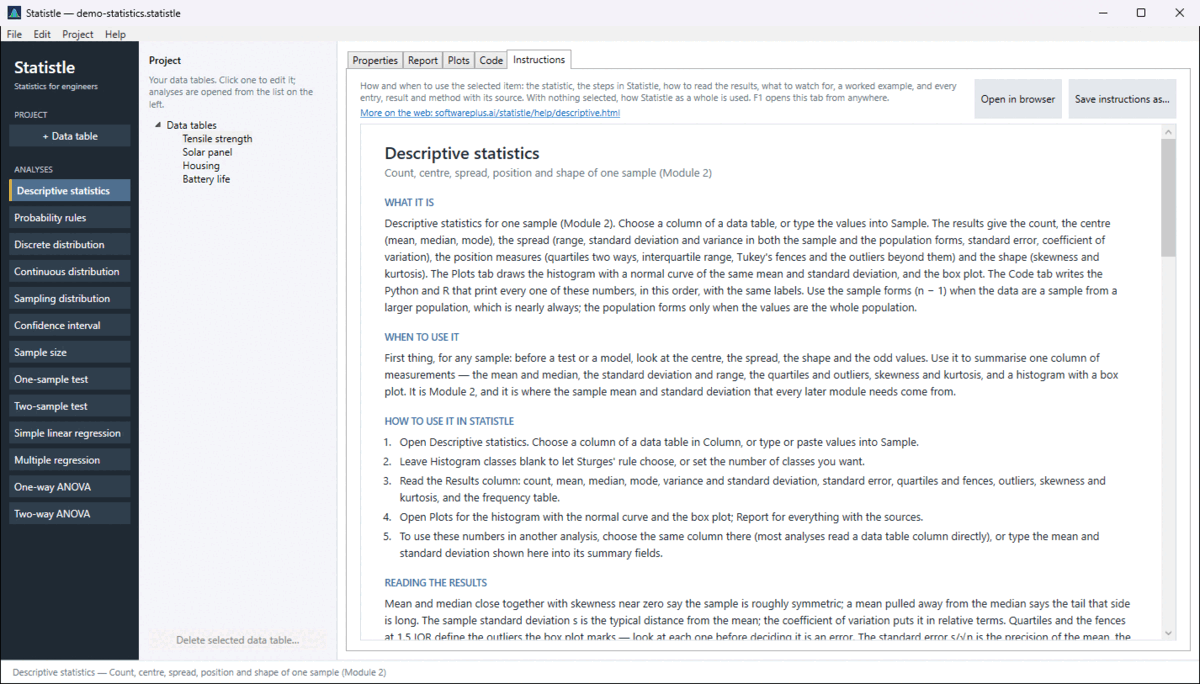
The help panel
The box under the form on the Properties tab explains whatever you click. Click into a field — or press Tab to move from field to field — and it says what that field is, how to choose it, its allowed range, and the method and source behind it. Click empty space on the form and it describes the whole item and the methods in use. If what you typed in that field was not used, the reason is at the top of the panel too. Read it before you trust a number: the point of Statistle is knowing which statistic answers the question, and why.
Notes above the form
- A red note says why the analysis cannot compute yet — for example "Choose the column holding the sample." See Messages.
- A blue note says that some fields are hidden because they belong to another choice: "Showing … fields belonging to other methods are hidden." Change the choice (the test, the distribution, Data from) and they come back.
- A yellow note with Use result and Cancel appears when you opened an analysis to work out a value for another one: "Result goes to … Set the inputs, then click Use result."
The menus
| Menu | Items |
|---|---|
| File | New project (Ctrl+N), Open… (Ctrl+O), Open the sample project, Save (Ctrl+S), Save As…, Export selected item as XML (advanced)…, Open report in browser, Save report as PDF…, Export data as CSV…, Exit |
| Edit | Undo (Ctrl+Z) |
| Project | Add data table, Delete selected data table… |
| Help | Help for this screen (F1), Help on the web (softwareplus.ai/statistle), Check for a new version…, About Statistle… (see The Help menu) |
New project, Open…, Open the sample project and Exit ask "Save changes …?" first when there is unsaved work (see Projects). The report, PDF, CSV and XML items work on the item selected; they are grey until a data table or an analysis is selected.
The status line at the bottom says what just happened ("Saved …", "Imported 3 columns from …") or describes the analysis you opened. The window title shows the project's file name, with a * when there are changes not yet saved.