Descriptive statistics
Module 2. The first thing to do with any sample: look at its centre, spread, shape and odd values before any test or model. The sample mean and standard deviation that later modules need come from here.
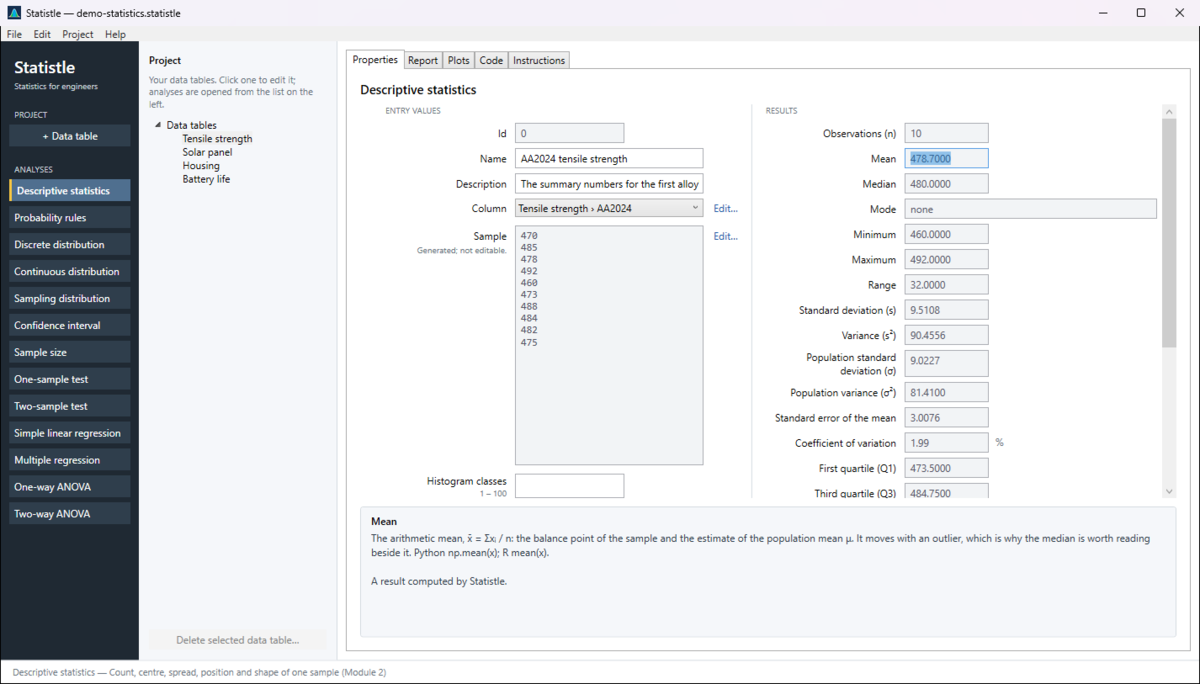
The entries
- Column — the column of a data table to summarise, or Entered below to type the values.
- Sample — the values, one per line (locked when a column is chosen).
- Histogram classes — leave it blank and Sturges' rule chooses; or set the number you want.
The results
Observations (n), Mean, Median, Mode, Minimum, Maximum, Range, Standard deviation (s), Variance (s²), the population versions (σ, σ²), Standard error of the mean, Coefficient of variation, First and Third quartile (Q1, Q3), Interquartile range, Tukey's lower and upper hinges, the lower and upper fences, Outliers, Skewness and Excess kurtosis, and the frequency table.
Reading them
- Mean and median close together, with skewness near zero: roughly symmetric. A mean pulled away from the median: a long tail on that side.
- s is the typical distance from the mean; the coefficient of variation puts it in relative terms.
- Points beyond the fences (1.5 × IQR past the quartiles) are marked as outliers. That is a flag, not a verdict — look at each one before calling it an error.
- The standard error s/√n is how precisely the mean is known; confidence intervals are built on it.
Watch out for
- Sample statistics (dividing by n − 1) are the main results. Use the population variance only when your data are the whole population.
- Quartiles have more than one convention. Statistle shows both Tukey's hinges (R
fivenum, the course's method) and the type-7 quartiles (R's default, Excel QUARTILE.INC), labelled. - Skewness and kurtosis are the adjusted versions (as Excel's SKEW and KURT); they need at least four values and are unreliable below about twenty.
Plots
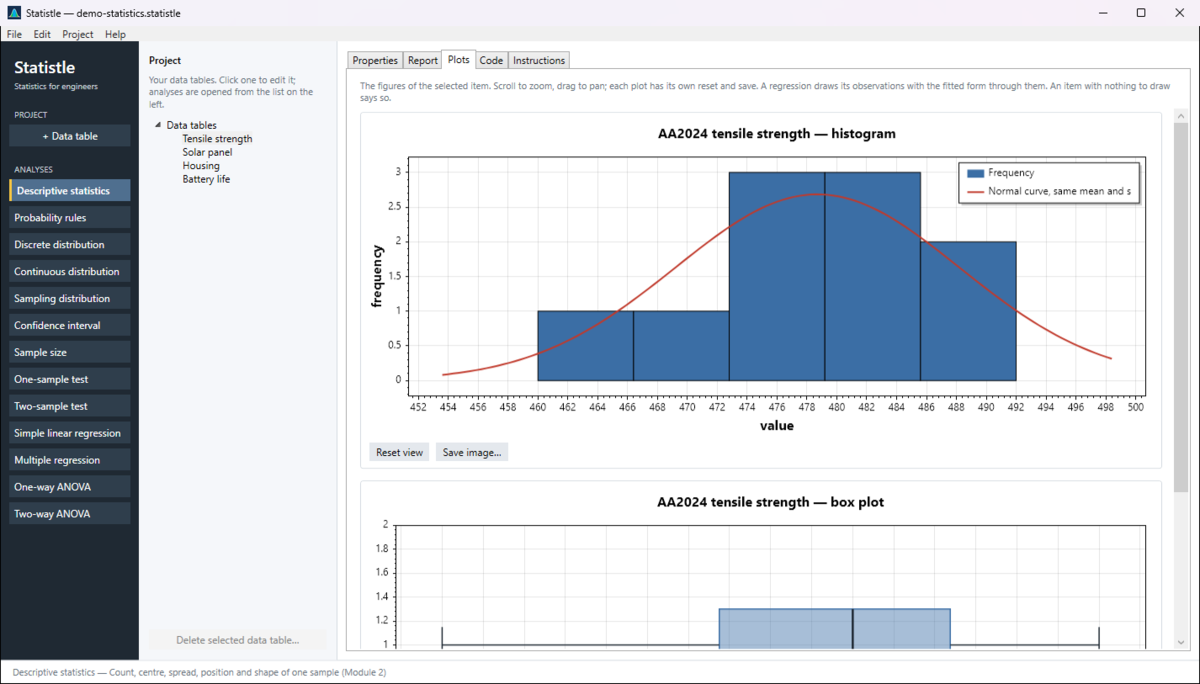
A histogram with the fitted normal curve over it, and a box plot showing the median, quartiles, whiskers to the fences, and outliers as points.
Example
In the sample project, the AA2024 column of Tensile strength: ten specimens, mean 478.7 MPa, standard deviation 9.5 MPa, no outliers, mild negative skew.
Where the formulas come from
EGN3443 Module 2; Montgomery and Runger, Applied Statistics and Probability for Engineers, 7th ed., Chapter 6; NIST/SEMATECH e-Handbook of Statistical Methods, section 1.3.5. The Instructions tab and the Report tab name the source of every method in use, and the help panel shows it when you click a field. The Code tab writes the same calculation in Python and R, formula first.