
A Surface Discharge Filter reads its capture from the retention curve at its Treatment Depth and removes the media’s share of the water it captures (Surface Discharge Filter, Media Methodology). When two filters are placed one after the other, there is more than one way to combine them. This page calculates one example three ways, with every step: the Applicant’s Handbook equation for BMPs in series (BMPFast’s default), the Equivalent Treatment Depth (BMPFast’s other choice), and the Specific Yield / Specific Retention method. BMPFast does not calculate Method 4; it is calculated on this page, from BMPFast’s retention curve.
The methods keep the numbers they have in the document Stormwater Treatment Train Justification and Water Quality Analysis for Filter Media in Series (Static Calculation Approach), written in review of BMPFast’s two methods: its Method 1 is the Handbook equation and its Method 2 the Equivalent Treatment Depth, BMPFast’s two choices. Its Method 3 (the smaller of the two Treatment Volumes, with the removals cascaded) turns out to be Method 4 with no Specific Retention, so it is the last row of the ratio table rather than a section of its own.
The example
Two Surface Discharge Filters one after the other: all the water that leaves Filter A goes to Filter B, and no other area drains to Filter B. Both filters treat the runoff of the same 12.00 ac. The filters are entered as Surface Discharge Filters with a Treatment Depth of 4.00 in each: in BMPFast 2, two treatments put together in a BMPs in Series; in BMPFast, two catchments, the first draining to the second (with no area of its own in the second). Because the methods use the retention curve, the catchment’s curve number, DCIA and rainfall zone set the result. (The 24 in minimum media depth of these mixes is a different depth: the Treatment Depth is the depth of runoff over the catchment that each filter treats.)
| Input | Value | Where it comes from |
|---|---|---|
| Catchment area | 12.00 ac | the example |
| Post-development land use | Highway (EMC TN 1.250 mg/L, TP 0.173 mg/L) | BMPFast’s land use table |
| Non-DCIA curve number | 60 | the example |
| DCIA | 50 % | the example |
| Rainfall zone | Florida Zone 1 | the example |
| Mean annual rainfall | 52 in/yr | BMPFast’s value for a new project until one is entered; it sets the loads (kg/yr) only, not the percentages |
| Filter A | ICS media: N reduction 80 %, P reduction 95 %, porosity (sustainable void fraction) 0.30 | BMPFast’s built-in media mixes |
| Filter B | B&G CTS24 media: N reduction 75 %, P reduction 95 %, porosity 0.30 | BMPFast’s built-in media mixes |
| Treatment Depth of each filter | 4.00 in, a Treatment Volume of 4.00 × 12.00 / 12 = 4.000 ac-ft each | the example |
The catchment’s runoff and loads
| Step | What is calculated | Calculation | Result |
|---|---|---|---|
| 1 | Runoff coefficient | BMPFast’s table for non-DCIA CN 60, DCIA 50 %, Florida Zone 1 | 0.451 |
| 2 | Annual runoff | 0.451 × 12.00 ac × 52 in / 12 | 23.452 ac-ft/yr |
| 3 | Nitrogen load | 23.452 ac-ft/yr × 1.250 mg/L × 1.233 (kg per ac-ft per mg/L) | 36.145 kg/yr |
| 4 | Phosphorus load | 23.452 ac-ft/yr × 0.173 mg/L × 1.233 (kg per ac-ft per mg/L) | 5.003 kg/yr |
BMPFast carries the loads unrounded (N 36.1454, P 5.0025 kg/yr), so a hand check of a later step can differ in its last digit.
The retention curve for this catchment
Every method reads the retention curve for non-DCIA CN 60, DCIA 50 % and Florida Zone 1: one curve, used for both nitrogen and phosphorus. These are BMPFast’s values at the table’s depths; between two depths BMPFast reads a straight line. The table stops at 4.00 in: a depth above it is given the 4.00 in value, 97.70 %.
| Treatment Depth (in) | Capture (%) | Treatment Depth (in) | Capture (%) |
|---|---|---|---|
| 0.00 | 0.00 | 2.25 | 92.30 |
| 0.25 | 35.90 | 2.50 | 93.60 |
| 0.50 | 56.50 | 2.75 | 94.60 |
| 0.75 | 69.00 | 3.00 | 95.40 |
| 1.00 | 76.90 | 3.25 | 96.20 |
| 1.25 | 82.20 | 3.50 | 96.80 |
| 1.50 | 85.90 | 3.75 | 97.30 |
| 1.75 | 88.60 | 4.00 | 97.70 |
| 2.00 | 90.60 |
The capture of each filter
A filter’s capture is the share of the annual runoff it treats: the curve at its Treatment Depth. It is the same for nitrogen and phosphorus. Both filters have a Treatment Depth of 4.00 in, so each, on its own, captures 97.70 % (the table at 4.00 in = 97.70 %). The other 2.30 % of the runoff, from the larger storms, goes past Filter A without being treated.
Method 1: the Applicant’s Handbook equation for BMPs in series
Each filter is calculated on its own, as if it were alone in the catchment: removal = capture × media reduction. The second filter then removes its share of the load the first lets through. This is the Applicant’s Handbook equation for BMPs in series (Volume I, Equation 9-5). It is BMPFast’s default for filters in series (in BMPFast: Handbook equation (each filter alone); in BMPFast 2: Handbook equation (each filter on its own; v1’s method)).
Removal of a filter (%) = capture at its Treatment Depth × media reduction / 100
Removal of the series (%) = E_A + E_B × (1 − E_A / 100)| Step | What is calculated | Nitrogen | Phosphorus |
|---|---|---|---|
| 1 | Removal of Filter A on its own (E_A) | 97.70 × 80 / 100 = 78.160 % | 97.70 × 95 / 100 = 92.815 % |
| 2 | Load leaving Filter A | 36.145 × (1 − 78.160 / 100) = 7.894 kg/yr | 5.003 × (1 − 92.815 / 100) = 0.359 kg/yr |
| 3 | Removal of Filter B on its own (E_B) | 97.70 × 75 / 100 = 73.275 % | 97.70 × 95 / 100 = 92.815 % |
| 4 | Load leaving Filter B (leaving the series) | 7.894 × (1 − 73.275 / 100) = 2.1097 kg/yr | 0.359 × (1 − 92.815 / 100) = 0.0258 kg/yr |
| 5 | Removal of the series | 100 × (36.145 − 2.1097) / 36.145 = 94.16 % | 100 × (5.003 − 0.0258) / 5.003 = 99.48 % |
BMPFast gives the same: N 94.16 %, P 99.48 % (BMPs in Series, Handbook equation). Step 5 is the same as E_A + E_B × (1 − E_A / 100): for nitrogen 78.160 + 73.275 × (1 − 78.160 / 100) = 94.16 %, for phosphorus 92.815 + 92.815 × (1 − 92.815 / 100) = 99.48 %.
Note. The phosphorus removal, 99.48 %, is more than the 97.70 % of the runoff the filters capture. The equation lets Filter B capture its share of everything that leaves Filter A, including the 2.30 % that went past Filter A untreated. That water comes in the larger storms, the same storms in which Filter B is already full with the water from Filter A, so in practice Filter B could not treat it.
Method 2: the Equivalent Treatment Depth
The two filters are treated as one retention system, as BMPFast does for retention BMPs in series. Each filter’s removal (from Method 1, steps 1 and 3) is turned into its Equivalent Treatment Depth: the depth at which the retention curve gives that removal. A retention BMP removes all the runoff it captures, so this is the depth of a retention BMP that would remove as much as the filter. The two depths are added, and the removal of the series is the curve read at the sum. Nitrogen and phosphorus are done separately, because the media reduce them differently. This is BMPFast’s other choice for filters in series (in BMPFast: Equivalent Treatment Depth (one system), in Catchment Configuration; in BMPFast 2: Equivalent treatment depth (the filters as one retention), on the BMPs in Series or the Catchment Routing). It is not in the Applicant’s Handbook: say in the submittal which method was used (Comparison of Methods for Calculating Filters in Series).
Equivalent Treatment Depth of a filter (in) = the depth where the retention curve gives its removal
Removal of the series (%) = the retention curve at (Equivalent Treatment Depth A + Equivalent Treatment Depth B)| Step | What is calculated | Nitrogen | Phosphorus |
|---|---|---|---|
| 1 | Removal of Filter A on its own (Method 1, step 1) | 78.160 % | 92.815 % |
| 2 | Equivalent Treatment Depth of Filter A | the curve gives 78.160 % between 1.00 in (76.90 %) and 1.25 in (82.20 %): 1.00 + (1.25 − 1.00) × (78.160 − 76.90) / (82.20 − 76.90) = 1.0594 in | the curve gives 92.815 % between 2.25 in (92.30 %) and 2.50 in (93.60 %): 2.25 + (2.50 − 2.25) × (92.815 − 92.30) / (93.60 − 92.30) = 2.3490 in |
| 3 | Removal of Filter B on its own (Method 1, step 3) | 73.275 % | 92.815 % |
| 4 | Equivalent Treatment Depth of Filter B | the curve gives 73.275 % between 0.75 in (69.00 %) and 1.00 in (76.90 %): 0.75 + (1.00 − 0.75) × (73.275 − 69.00) / (76.90 − 69.00) = 0.8853 in | the curve gives 92.815 % between 2.25 in (92.30 %) and 2.50 in (93.60 %): 2.25 + (2.50 − 2.25) × (92.815 − 92.30) / (93.60 − 92.30) = 2.3490 in |
| 5 | Equivalent Treatment Depth of the series: the sum | 1.0594 + 0.8853 = 1.9447 in | 2.3490 + 2.3490 = 4.6980 in |
| 6 | Removal of the series: the curve at the sum | between 1.75 in (88.60 %) and 2.00 in (90.60 %): 88.60 + (90.60 − 88.60) × (1.9447 − 1.75) / (2.00 − 1.75) = 90.16 % | the table at 4.00 in = 97.70 %; 4.698 in is beyond the table’s last depth, so BMPFast uses that depth’s value |
| 7 | Load leaving the series | 36.145 × (1 − 90.16 / 100) = 3.557 kg/yr | 5.003 × (1 − 97.70 / 100) = 0.115 kg/yr |
BMPFast gives the same: N 90.16 %, P 97.70 % (BMPs in Series, equivalent treatment depth).
Note. For phosphorus the sum, 4.6980 in, is beyond the curve’s last depth (4.00 in), so the removal is the 4.00 in value, 97.70 %: the capture of one filter on its own. With filters this deep the method cannot give more than that.
Method 4: Specific Yield / Specific Retention
This is Method 4 of the document Filter Media in Series. The water a filter’s media holds is its porosity. Part of it drains out by gravity, the Specific Yield (Sy); the rest stays held in the pores by capillary forces, the Specific Retention (Sr, the field capacity). Only the water that drains out of Filter A goes to Filter B. Filter B’s capture is read on the curve at the depth of that water over the catchment, so Filter B treats less of the runoff than Filter A.
Porosity = Specific Yield + Specific Retention
Ratio = Specific Yield / Specific Retention
Share of Filter A's water that drains to Filter B = Sy / porosity = Ratio / (1 + Ratio)
Depth given to Filter B (in) = Treatment Depth of A × Ratio / (1 + Ratio), no more than B's own Treatment Depth
Removal (%) = (C_A − C_B) × M_A + C_B × [M_A + M_B × (1 − M_A)]
   C_A, C_B: captures of A and B from the curve;  M_A, M_B: media reductions (as fractions)
The runoff then takes one of three paths: past both filters (100 − C_A), through Filter A only (C_A − C_B: water Filter A captured but held, or that Filter B could not take), and through both (C_B). The load on each path is reduced by the filters it passes through. As in the document, the load in the water Filter A holds is treated by Filter A only and counted as leaving the series: it does not pass Filter B.
Worked example: a ratio of 4
The document’s split for filter sand, Specific Yield 0.20 and Specific Retention 0.05, is a ratio of 0.20 / 0.05 = 4. With the media’s porosity of 0.30 the same ratio is Sy 0.240 and Sr 0.060. The result depends only on the ratio, not on the porosity: the share that drains is Ratio / (1 + Ratio) whatever the porosity.
The water (water steps 1 to 9)
| Step | What is calculated | Calculation | Result |
|---|---|---|---|
| 1 | Specific Yield and Specific Retention of Filter A’s media | porosity 0.30 split in the ratio 4 : 1 | Sy = 0.240, Sr = 0.060 |
| 2 | Water Filter A holds (its Treatment Volume) | 4.00 in × 12.00 ac / 12 | 4.000 ac-ft |
| 3 | Water that stays in Filter A’s media | 4.000 × Sr / porosity = 4.000 × 0.060 / 0.30 | 0.800 ac-ft |
| 4 | Water that drains out of Filter A to Filter B | 4.000 − 0.800 | 3.200 ac-ft |
| 5 | Treatment Depth Filter B is given | 12 × 3.200 / 12.00 (no more than its own 4.00 in) | 3.200 in |
| 6 | Capture of Filter B: the curve at that depth | between 3.00 in (95.40 %) and 3.25 in (96.20 %): 95.40 + (96.20 − 95.40) × (3.200 − 3.00) / (3.25 − 3.00) = 96.04 % | 96.04 % |
| 7 | Runoff that goes past both filters | 100 − 97.70 | 2.30 % |
| 8 | Runoff treated by Filter A only | 97.70 − 96.04 | 1.66 % |
| 9 | Runoff treated by both filters | the capture of Filter B | 96.04 % |
The loads (load steps 1 to 8)
| Step | What is calculated | Nitrogen | Phosphorus |
|---|---|---|---|
| 1 | Load that goes past both filters (water step 7), untreated | 36.145 × 2.30 / 100 = 0.831 kg/yr | 5.003 × 2.30 / 100 = 0.115 kg/yr |
| 2 | Load treated by Filter A only (water step 8) | 36.145 × 1.66 / 100 = 0.600 kg/yr | 5.003 × 1.66 / 100 = 0.083 kg/yr |
| 3 | Removed by Filter A from it (A’s media reduction) | 0.600 × 80 / 100 = 0.480; leaves 0.120 kg/yr | 0.083 × 95 / 100 = 0.079; leaves 0.004 kg/yr |
| 4 | Load treated by both filters (water step 9) | 36.145 × 96.04 / 100 = 34.714 kg/yr | 5.003 × 96.04 / 100 = 4.804 kg/yr |
| 5 | Removed by Filter A from it | 34.714 × 80 / 100 = 27.771; 6.943 kg/yr goes on to B | 4.804 × 95 / 100 = 4.564; 0.240 kg/yr goes on to B |
| 6 | Removed by Filter B from what Filter A lets through (B’s media reduction) | 6.943 × 75 / 100 = 5.207; leaves 1.736 kg/yr | 0.240 × 95 / 100 = 0.228; leaves 0.012 kg/yr |
| 7 | Load leaving the series: the three paths added | 0.831 + 0.120 + 1.736 = 2.687 kg/yr | 0.115 + 0.004 + 0.012 = 0.131 kg/yr |
| 8 | Removal of the series | 100 × (36.145 − 2.687) / 36.145 = 92.57 % | 100 × (5.003 − 0.131) / 5.003 = 97.38 % |
Method 4 for different ratios
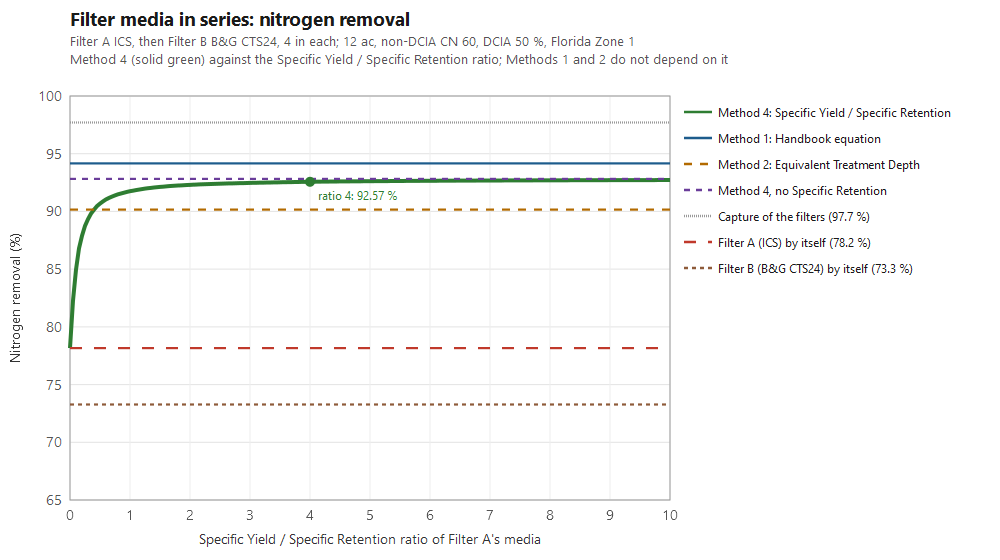
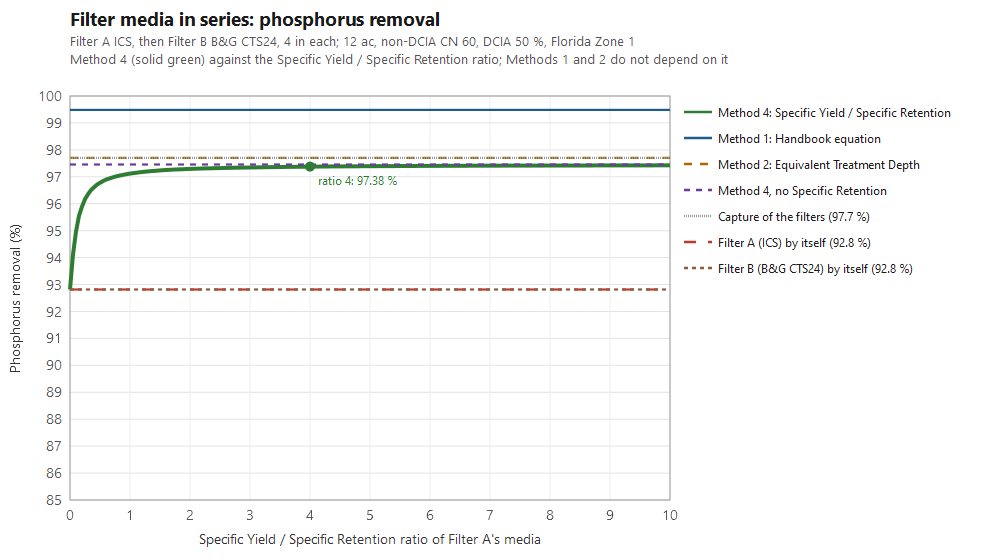
The same example for a range of Specific Yield / Specific Retention ratios. A ratio of 0 is media that holds all the water it captures (nothing reaches Filter B: Filter A on its own). The higher the ratio, the more water drains on to Filter B. With no Specific Retention (the last row), all of it does: Filter B captures what Filter A captures, which is the document’s Method 3.
| Ratio Sy / Sr | Sy and Sr at porosity 0.30 | Share of A’s water that drains to B | Depth given to B (in) | Capture of B (%) | N removal (%) | P removal (%) | N leaving (kg/yr) | P leaving (kg/yr) |
|---|---|---|---|---|---|---|---|---|
| 0 | 0.000 and 0.300 | 0.0 % | 0.00 | 0.00 | 78.16 | 92.81 | 7.894 | 0.359 |
| 0.25 | 0.060 and 0.240 | 20.0 % | 0.80 | 70.58 | 88.75 | 96.17 | 4.067 | 0.192 |
| 0.5 | 0.100 and 0.200 | 33.3 % | 1.33 | 83.43 | 90.68 | 96.78 | 3.371 | 0.161 |
| 1 | 0.150 and 0.150 | 50.0 % | 2.00 | 90.60 | 91.75 | 97.12 | 2.982 | 0.144 |
| 1.5 | 0.180 and 0.120 | 60.0 % | 2.40 | 93.08 | 92.12 | 97.24 | 2.848 | 0.138 |
| 2 | 0.200 and 0.100 | 66.7 % | 2.67 | 94.27 | 92.30 | 97.29 | 2.783 | 0.135 |
| 3 | 0.225 and 0.075 | 75.0 % | 3.00 | 95.40 | 92.47 | 97.35 | 2.722 | 0.133 |
| 4 | 0.240 and 0.060 | 80.0 % | 3.20 | 96.04 | 92.57 | 97.38 | 2.687 | 0.131 |
| 5 | 0.250 and 0.050 | 83.3 % | 3.33 | 96.40 | 92.62 | 97.39 | 2.668 | 0.130 |
| 6 | 0.257 and 0.043 | 85.7 % | 3.43 | 96.63 | 92.65 | 97.40 | 2.655 | 0.130 |
| 8 | 0.267 and 0.033 | 88.9 % | 3.56 | 96.91 | 92.70 | 97.42 | 2.640 | 0.129 |
| 10 | 0.273 and 0.027 | 90.9 % | 3.64 | 97.07 | 92.72 | 97.43 | 2.631 | 0.129 |
| 20 | 0.286 and 0.014 | 95.2 % | 3.81 | 97.40 | 92.77 | 97.44 | 2.614 | 0.128 |
| no Specific Retention | 0.300 and 0.000 | 100.0 % | 4.00 | 97.70 | 92.81 | 97.46 | 2.597 | 0.127 |
The three methods side by side
| Method | N removal | P removal | N leaving | P leaving |
|---|---|---|---|---|
| Filter A on its own (for reference) | 78.16 % | 92.81 % | ||
| Method 1: Handbook equation (BMPFast’s default) | 94.16 % | 99.48 % | 2.110 kg/yr | 0.026 kg/yr |
| Method 2: Equivalent Treatment Depth (BMPFast’s other choice) | 90.16 % | 97.70 % | 3.557 kg/yr | 0.115 kg/yr |
| Method 4: Specific Yield / Specific Retention, ratio 4 | 92.57 % | 97.38 % | 2.687 kg/yr | 0.131 kg/yr |
| Method 4 over the ratios (0 to no Specific Retention) | 78.16 to 92.81 % | 92.81 to 97.46 % |
What the comparison shows.
- Method 1 gives the most. It lets Filter B treat runoff that went past Filter A, so its phosphorus removal (99.48 %) is above the 97.70 % of the runoff the filters capture.
- Method 2 stops at the end of the curve. For phosphorus the equivalent depths add up to more than 4.00 in, so the removal is the curve’s last value, 97.70 %, above Method 4 at every ratio. For nitrogen it gives 90.16 %, the lowest of the three methods for any ratio from 0.41 up.
- Method 4 can never be more than the capture of Filter A. No load is removed from the 2.30 % of the runoff that goes past Filter A. With deep filters like these the curve is flat, so the ratio changes Filter B’s capture only a little: from a ratio of 1 up, nitrogen removal is between 91.75 % and 92.81 %.
- The ratio matters most where the curve is steep (below about 1.5 in for this catchment). In the ratio table, a ratio of 0.25 gives Filter B only 0.80 in and the nitrogen removal falls to 88.75 %. For shallow filters, such as the two 0.5 in filters on Comparison of Methods for Calculating Filters in Series, the ratio would matter at every value.
- Method 3 of the document (the smaller of the two Treatment Volumes, with the removals cascaded) is Method 4 with no Specific Retention, the last row of the ratio table.
- Which to use. BMPFast uses Method 1 unless Method 2 is chosen. Method 2 is not in the Applicant’s Handbook, and BMPFast does not calculate Method 4. Say in the submittal which method was used.
Related pages
- Comparison of Methods for Calculating Filters in Series: Methods 1 and 2 for two equal filters of 0.5 in.
- Surface Discharge Filter: the worksheet.
- Media Methodology: the media mixes and their reductions.
- Retention Methodology: the retention curves.
- Catchment Configuration (BMPFast) and BMPs in Series (BMPFast 2): where the method for filters in series is chosen.