
A Surface Discharge Filter reads its capture from the retention curves at its Treatment Depth and removes the media’s share of the water it captures: removal = capture × media reduction (Surface Discharge Filter, Media Methodology). When two filters are placed one after the other, in one catchment (BMPs in Series) or in two catchments routed one into the other (Routing), there are two ways to combine them. This page calculates both and compares them.
Method 1: each filter on its own, routed to the next
Each filter is calculated on its own. The first removes its share of the load; what it lets through goes to the second, which removes its share of that. This is BMPFast’s default.
Applicant’s Handbook reference
Section 9.5.1 Treatment Train Nutrient Reduction (Equation 9-5): Method 1 is Equation 9-5: 1 − [(1 − Eff1) × (1 − Eff2)], each filter acting independently on what the one before it lets through.
Appendix O, Detention with Engineered Media and Filtration: gives “Treatment efficiency for Detention Pond with Filtration = (Detention efficiency for Volume of the water Detained in the system) + (Volume of water filtered and not detained * Treatment Efficiency of Media)”; each filter’s removal (capture × media reduction) is BMPFast’s reading of the filtered term.
Removal of filter i (%) = capture at its Treatment Depth (retention curves) × media reduction / 100
Removal of the series (%) = 100 × [1 − (1 − removal 1 / 100) × (1 − removal 2 / 100)]
Method 2: equivalent Treatment Depths added
Each filter’s removal is turned into an equivalent Treatment Depth: the depth at which the retention curves give that removal as capture. The equivalent depths are added, and the curves are read at the sum. This is how retention BMPs in series are combined (the Equivalent Treatment Depth of BMPs in Series).
Applicant’s Handbook reference
Appendix O, Dry Retention Systems: removal is read from the tables at the retention depth in inches over the catchment area; the handbook does not describe equivalent treatment depths for filters, or adding them. Method 2 is a method proposed for BMPFast, not a handbook method.
Source reference
A method allowed in BMPFast and BMPFast 2 (Ron Eaglin, 2026-10-19 and 2026-10-20): adding equivalent Treatment Depths extends BMPFast’s rule for retention BMPs in series (BMP Trains 2020 User Manual, Stormwater Management Academy, University of Central Florida, December 2021 (stars.library.ucf.edu/bmptrains/25)) to filters; it is not in the handbook or the BMPTrains model. Method 1 is BMPFast’s default.
Equivalent Treatment Depth of filter i (in) = the depth where the retention curves give its removal
Removal of the series (%) = retention curves at (equivalent depth 1 + equivalent depth 2)
(N and P separately: the media reduce N and P differently, so each has its own equivalent depths)
A second reading of “equivalent Treatment Depth” is the filter’s Treatment Depth times its media reduction (2b in the table below). It is shown for comparison only.
Worked example, step by step
Two Surface Discharge Filters with B&G CTS12 media (N reduction 60 %, P reduction 90 %) in a 12.00 ac catchment, one after the other: all the water that enters the first goes on to the second. The two therefore treat the same water from the same 12.00 ac, and have the same Treatment Volume, 0.500 ac-ft, and the same Treatment Depth. The catchment has a Non-DCIA Curve Number of 70 and DCIA of 24.33 % in Florida Zone 2; the retention curves for it are the program’s, read every 0.005 in. For illustration, 10.000 kg/yr of nitrogen and 2.000 kg/yr of phosphorus reach the first filter (the percentages do not depend on the load). Each value is rounded as it is calculated (percentages to 0.1, loads to 0.001 kg/yr, depths to 0.001 in), so every line can be checked by hand.
Both methods: the Treatment Depth and capture of each filter
Both methods start from the filters’ Treatment Volumes. A filter’s Treatment Depth is its Treatment Volume spread over the area draining to it, in inches. All the water entering filter 1 goes to filter 2, so both filters have the same area draining to them and the same Treatment Volume, and so the same Treatment Depth. The Treatment Volumes are the same in both methods, so the Treatment Depths are the same, and so are the captures read at them; the methods differ only in how the two filters’ removals are combined (the steps after these). The capture is the share of the runoff a filter treats: the retention curves at its Treatment Depth, the same for nitrogen and phosphorus.
Treatment Depth (in) = 12 (in/ft) × Treatment Volume (ac-ft) / area draining to the filter (ac)| Step | What is calculated | Value |
|---|---|---|
| A | Treatment Depth of filter 1 | 12 × 0.500 / 12.00 = 0.500 in |
| B | Treatment Depth of filter 2 | 12 × 0.500 / 12.00 = 0.500 in |
| C | Capture of filter 1 at its Treatment Depth (step A) | curves at 0.500 in = 75.31 %, so 75.3 % |
| D | Capture of filter 2 at its Treatment Depth (step B) | curves at 0.500 in = 75.31 %, so 75.3 % |
Method 1: each filter on its own, routed to the next
| Step | What is calculated | Nitrogen | Phosphorus |
|---|---|---|---|
| 1 | Load reaching filter 1 | 10.000 kg/yr | 2.000 kg/yr |
| 2 | Removal of filter 1 = capture (step C) × media reduction / 100 | 75.3 × 60 / 100 = 45.2 % | 75.3 × 90 / 100 = 67.8 % |
| 3 | Load removed by filter 1 | 10.000 × 45.2 / 100 = 4.520 kg/yr | 2.000 × 67.8 / 100 = 1.356 kg/yr |
| 4 | Load leaving filter 1 = load reaching filter 2 | 10.000 − 4.520 = 5.480 kg/yr | 2.000 − 1.356 = 0.644 kg/yr |
| 5 | Removal of filter 2 = capture (step D) × media reduction / 100 | 75.3 × 60 / 100 = 45.2 % | 75.3 × 90 / 100 = 67.8 % |
| 6 | Load removed by filter 2 | 5.480 × 45.2 / 100 = 2.477 kg/yr | 0.644 × 67.8 / 100 = 0.437 kg/yr |
| 7 | Load leaving filter 2 (leaving the series) | 5.480 − 2.477 = 3.003 kg/yr | 0.644 − 0.437 = 0.207 kg/yr |
| 8 | Removal of the series | 100 × (10.000 − 3.003) / 10.000 = 70.0 % | 100 × (2.000 − 0.207) / 2.000 = 89.6 % |
Step 8 is the same as 100 × [1 − (1 − removal 1 / 100) × (1 − removal 2 / 100)], the formula above.
Method 2: equivalent Treatment Depths added
| Step | What is calculated | Nitrogen | Phosphorus |
|---|---|---|---|
| 1 | Removal of filter 1 = capture (step C) × media reduction / 100 | 75.3 × 60 / 100 = 45.2 % | 75.3 × 90 / 100 = 67.8 % |
| 2 | Equivalent Treatment Depth of filter 1: the depth where the retention curves give that removal | the curves give 45.2 % between 0.195 in (44.62 %) and 0.200 in (45.76 %): 0.195 + (0.200 − 0.195) × (45.2 − 44.62) / (45.76 − 44.62) = 0.198 in | the curves give 67.8 % between 0.395 in (67.70 %) and 0.400 in (68.07 %): 0.395 + (0.400 − 0.395) × (67.8 − 67.70) / (68.07 − 67.70) = 0.396 in |
| 3 | Removal of filter 2 = capture (step D) × media reduction / 100 | 75.3 × 60 / 100 = 45.2 % | 75.3 × 90 / 100 = 67.8 % |
| 4 | Equivalent Treatment Depth of filter 2 | the curves give 45.2 % between 0.195 in (44.62 %) and 0.200 in (45.76 %): 0.195 + (0.200 − 0.195) × (45.2 − 44.62) / (45.76 − 44.62) = 0.198 in | the curves give 67.8 % between 0.395 in (67.70 %) and 0.400 in (68.07 %): 0.395 + (0.400 − 0.395) × (67.8 − 67.70) / (68.07 − 67.70) = 0.396 in |
| 5 | Equivalent Treatment Depth of the series = the sum | 0.198 + 0.198 = 0.396 in | 0.396 + 0.396 = 0.792 in |
| 6 | Removal of the series: the retention curves at the sum | curves between 0.395 in (67.70 %) and 0.400 in (68.07 %): 67.70 + (68.07 − 67.70) × (0.396 − 0.395) / (0.400 − 0.395) = 67.8 % | curves between 0.790 in (84.00 %) and 0.795 in (84.10 %): 84.00 + (84.10 − 84.00) × (0.792 − 0.790) / (0.795 − 0.790) = 84.0 % |
| 7 | Load leaving the series | 10.000 × (1 − 67.8 / 100) = 3.220 kg/yr | 2.000 × (1 − 84.0 / 100) = 0.320 kg/yr |
Method 2b: Treatment Depth × media reduction, added
For comparison only: here the equivalent Treatment Depth is the filter’s Treatment Depth (steps A and B) times its media reduction.
| Step | What is calculated | Nitrogen | Phosphorus |
|---|---|---|---|
| 1 | Equivalent Treatment Depth of filter 1 = Treatment Depth × media reduction / 100 | 0.500 × 60 / 100 = 0.300 in | 0.500 × 90 / 100 = 0.450 in |
| 2 | Equivalent Treatment Depth of filter 2 | 0.500 × 60 / 100 = 0.300 in | 0.500 × 90 / 100 = 0.450 in |
| 3 | Sum | 0.300 + 0.300 = 0.600 in | 0.450 + 0.450 = 0.900 in |
| 4 | Removal of the series: the retention curves at the sum | curves at 0.600 in = 78.48 %, so 78.5 % | curves at 0.900 in = 86.10 %, so 86.1 % |
| 5 | Load leaving the series | 10.000 × (1 − 78.5 / 100) = 2.150 kg/yr | 2.000 × (1 − 86.1 / 100) = 0.278 kg/yr |
The results side by side
| Method 1: removal (load leaving) | Method 2 | 2b | Method 2 − Method 1 (points) | |
|---|---|---|---|---|
| Nitrogen | 70.0 % (3.003 kg/yr) | 67.8 % (3.220 kg/yr) | 78.5 % (2.150 kg/yr) | -2.2 |
| Phosphorus | 89.6 % (0.207 kg/yr) | 84.0 % (0.320 kg/yr) | 86.1 % (0.278 kg/yr) | -5.6 |
The two methods compared
| Treatment Depths (in) | Media | Each filter alone (%) | Method 1 (%) | Equivalent depths (in) | Method 2 (%) | 2b (%) | Method 2 − Method 1 | |
|---|---|---|---|---|---|---|---|---|
| 0.5 + 0.5 | B&G CTS12 | N | 45.2 / 45.2 | 70.0 | 0.20 + 0.20 | 67.7 | 78.5 | -2.3 |
| 0.5 + 0.5 | B&G CTS12 | P | 67.8 / 67.8 | 89.6 | 0.40 + 0.40 | 84.0 | 86.1 | -5.6 |
| 0.25 + 0.25 | B&G CTS12 | N | 34.3 / 34.3 | 56.9 | 0.15 + 0.15 | 60.8 | 60.8 | +4.0 |
| 0.25 + 0.25 | B&G CTS12 | P | 51.5 / 51.5 | 76.5 | 0.23 + 0.23 | 71.7 | 71.7 | -4.8 |
| 1.0 + 1.0 | B&G CTS12 | N | 52.8 / 52.8 | 77.7 | 0.23 + 0.23 | 72.5 | 90.4 | -5.2 |
| 1.0 + 1.0 | B&G CTS12 | P | 79.2 / 79.2 | 95.7 | 0.62 + 0.62 | 90.9 | 94.8 | -4.7 |
| 0.5 + 0.5 | B&G ECT Mixes | N | 33.9 / 33.9 | 56.3 | 0.15 + 0.15 | 60.5 | 71.7 | +4.3 |
| 0.5 + 0.5 | B&G ECT Mixes | P | 33.9 / 33.9 | 56.3 | 0.15 + 0.15 | 60.5 | 71.7 | +4.3 |
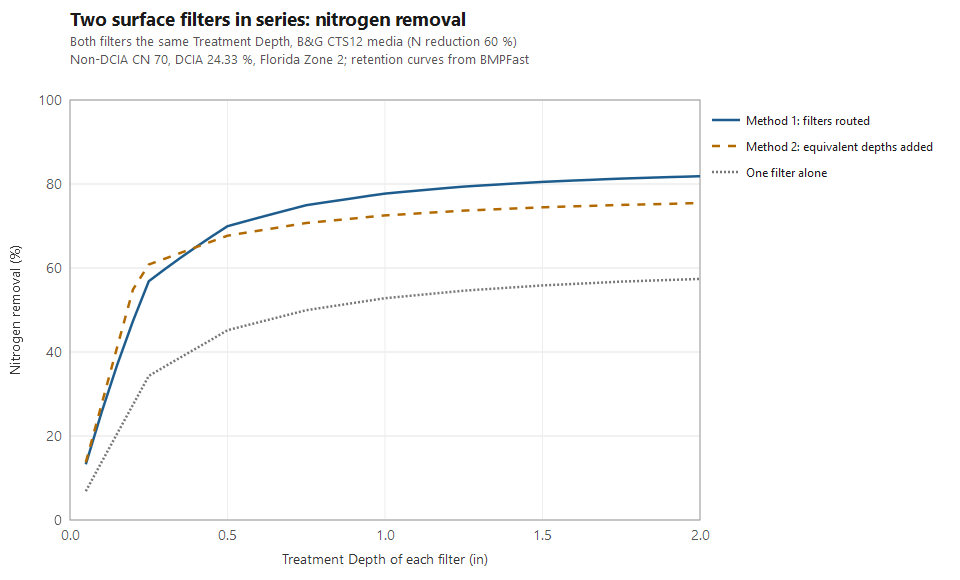
What the comparison shows. Neither method always gives more. Method 2 gives more removal when each filter removes little (shallow filters, or media that remove little), and Method 1 gives more when each filter removes a lot. The reason is the shape of the retention curves: they rise steeply at small depths and flatten towards 4 in. Adding two small equivalent depths moves up the steep part, which raises the removal more than multiplying the two removals; adding two large ones lands on the flat part, which raises it less. For two equal filters the methods cross at a Treatment Depth of 0.40 in for nitrogen and 0.20 in for phosphorus with B&G CTS12, and 1.22 in with B&G ECT.
Method 1 treats the second filter as if the water reaching it were ordinary runoff. It is what the first filter let through: the runoff it did not capture, mostly from the larger storms, plus the filtered water. Method 2 treats the two filters as one larger storage, as BMPFast does for retention BMPs in series, and so assumes the second filter’s storage adds to the first’s.
Decided (Ron Eaglin, 2026-10-19): both methods are allowed. BMPFast 2 offers them as a choice, Surface discharge filters in series: on a BMPs in Series’ Entry tab (for the filters from BMP 1 on), and on a Catchment Routing’s Entry tab (for catchments one after another whose treatments are all filters). Handbook equation is Method 1, the default; Equivalent treatment depth is Method 2. BMPFast (v1) offers the same choice for catchments routed one into another whose BMPs are all Surface Discharge Filters: Surface Discharge Filters (Filtration) in series on the Catchment Configuration window, under the diagram, shown when one filter catchment drains to another (Ron Eaglin, 2026-10-20). A v1 BMPs in Series cannot hold two filters (a catchment has one of each BMP), so the choice does not apply there. Method 2b above is shown for comparison only and is not offered. Method 2 is not in the handbook: say which method you used in your submittal.
Method 2 in a routing. When filters are in different catchments, each filter’s equivalent Treatment Depth is read on its own catchment’s retention curves (its Non-DCIA Curve Number and DCIA), the depths are added along the run of catchments, and the removal is the curves at the sum with the area-weighted Non-DCIA Curve Number and DCIA of those catchments, applied to all the load that has entered the run. It is used only where the catchments follow one another with no other water joining them and every treatment is a filter; elsewhere each filter is calculated on its own. The routing’s Entry tab (in v1, the line under the choice on the Catchment Configuration) says where it was used, and the Flow Balance report shows each system. A filter removes no runoff volume, so all the runoff goes on.
Sample problems
Worked problems solved in BMPFast, each with every input, the steps with screen captures, the program’s results, a hand check and the project file to download. Captures are for demonstration only. All of them: BMPFast sample problems.
- BMPs in series: retention basin then wet pond
- BMPs in series: two retention basins
- BMPs in series: wet pond with stormwater harvesting
- BMPs in series: permeable pavement then wet pond
- BMPs in series: tree well, exfiltration and retention
- Sizing a filter after a retention basin
- Sizing a filter after a wet pond
Two different media, and a third method. Comparison of Methods for Filter Media in Series calculates Filter A (ICS) then Filter B (B&G CTS24), 4 in each, in a 12 ac Highway catchment by Methods 1 and 2 of this page, step by step, and by a third method, Specific Yield / Specific Retention, in which only the water that drains out of Filter A goes to Filter B.
Related pages
- Surface Discharge Filter: the worksheet.
- Media Methodology: the media mixes and their reductions.
- Retention Methodology and Retention BMPs: the retention curves.
- BMPs in Series: several BMPs in one catchment, and the Equivalent Treatment Depth.
- Routing: BMPs in catchments routed one into another.
- Comparison of Methods for Calculating Retention Followed by a Surface Discharge Filter.
- Comparison of Methods for Filter Media in Series: two different media (ICS, then B&G CTS24), these two methods and the Specific Yield / Specific Retention method.