The page players see
Every study becomes one web page. It is one file that needs nothing from the internet: it runs in any browser on a computer, tablet or phone, with no account and nothing to install. It collects nothing; the player's name is never sent anywhere. Try it now: LPGA Traffic Lab or Four-Way Intersection.
A page opens blank, as a puzzle: today's network with no plan. The plan is the player's work.
The instructions and the name
The page opens with its instructions. Your goal: cut the time drivers spend waiting, without going over the budget. Level of Service runs from A (traffic flows freely) to F (jammed). The four steps:
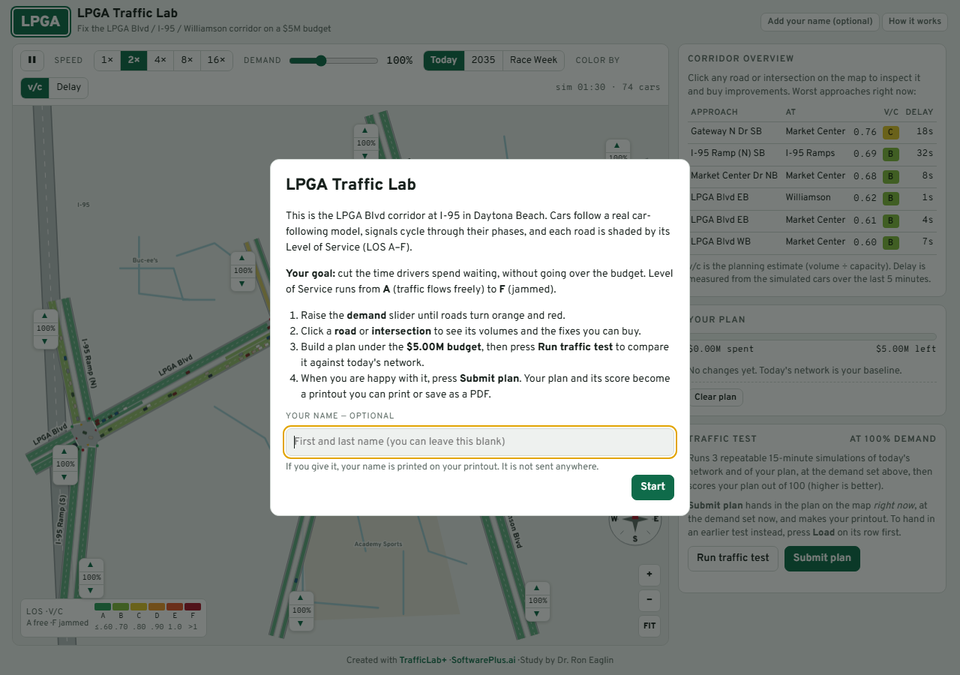
- Raise the demand slider until roads turn orange and red.
- Click a road or intersection to see its volumes and the fixes you can buy.
- Build a plan under the budget, then press Run traffic test to compare it against today's network.
- When you are happy with it, press Submit plan. Your plan and its score become a printout you can print or save as a PDF.
Your name — optional. A player may leave it blank and still play. If given, it is printed on the printout. Press Start. Later, Add your name (optional) at the top right adds or changes it, and How it works beside it shows the instructions again.
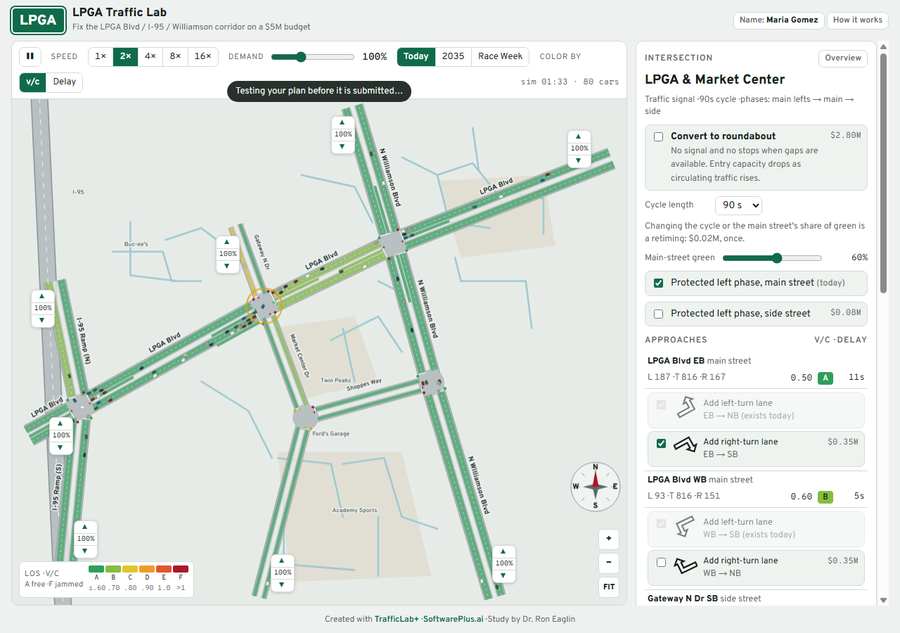
The map and toolbar
- Pause and Speed (1× to 16×) control the simulation.
- Demand: the slider runs from 50% to 200% of today's traffic; the demand buttons beside it (like Today, 2035, Race Week) set it at once.
- Color by: v/c (the planning estimate, volume ÷ capacity) or Delay (measured from the simulated cars). The legend shows the colours from A to F.
- The ▲ and ▼ beside each road end raise or lower the traffic entering there.
- +, − and FIT zoom the map. Hover over a road or intersection for its figures.
Building a plan
Click an intersection or a road. The panel on the right shows its traffic — each approach's volume, v/c with its LOS, and delay — and the fixes you can buy, each with its price: add a left-turn or right-turn lane, add a through lane in each direction, retime the signal (cycle length, main-street green), add a protected left phase, or convert the signal to a roundabout. Each fix goes into Your plan, with a budget bar showing what is spent and what is left. Clear plan starts again; × beside a fix removes it. Over budget, the page warns that the score will be halved.
The traffic test and the score
Run traffic test runs three repeatable 15-minute simulations of today's network and of your plan, at the demand set now, and scores the plan out of 100 (higher is better). Each test is listed; the best so far is highlighted, and Load puts that test's plan back on the map. The score is made of:
| Part | Points |
|---|---|
| Delay per trip, against today | 50 |
| Approaches at LOS D or better | 25 |
| Budget left | 15 |
| Trips completed vs demanded | 10 |
A plan over budget scores half, and a plan that leaves traffic with no route gets a large penalty.
For instructors: a plan is tested at whatever demand the player has set, and the printout says which. Two scores compare only if they were tested at the same demand, so tell the class which demand button to submit at.
Submit plan and the printout
Submit plan hands in the plan on the map right now, at the demand set now (it is tested first if it has not been). To hand in an earlier test instead, press Load on its row first. The printout shows the study's title, the player's name (or Name not given), the date, the demand it was tested at, the score and its parts, the plan with its cost, today against the plan (delay, trips completed, LOS, worst approach, vehicle-hours of delay), and every approach. At its top is a box, Name on the printout — optional, to add or correct the name before printing.
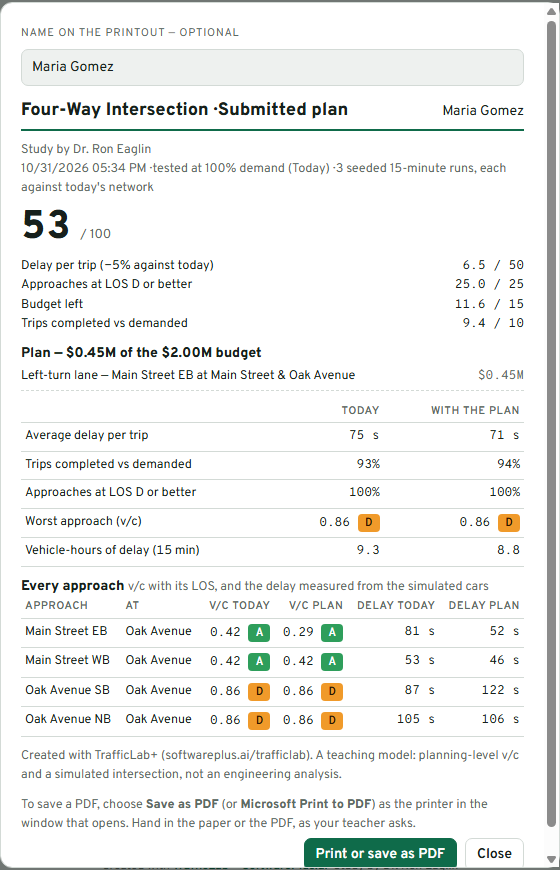
Press Print or save as PDF; to save a PDF, choose Save as PDF (or Microsoft Print to PDF) as the printer. Only the printout is printed, not the map.
Handing it in
- A student who built a study publishes it (Publishing) and hands in the link: the summary page of all their studies, or one study's own page — whichever the instructor asked for.
- A student who played a study hands in the printout, on paper or as a PDF, as the teacher asks.
At the foot of every page is Created with TrafficLab+ · SoftwarePlus.ai (both links), the study's author, and credits to OpenStreetMap and FDOT where their data was used. The printout says it is a teaching model — planning-level v/c and a simulated intersection or corridor, not an engineering analysis.
← The challenge and the preview Publishing to GitHub Pages →