
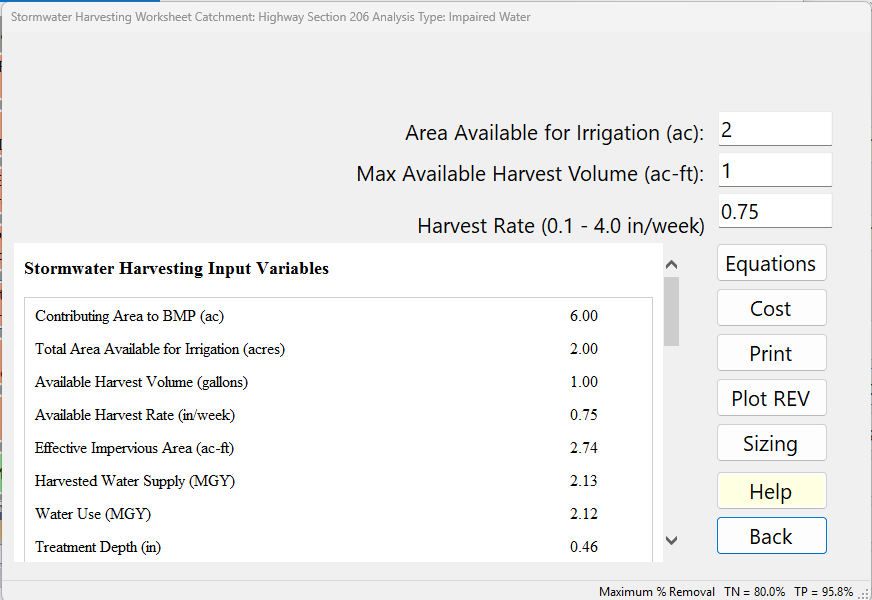
The Stormwater Harvesting Worksheet calculates how much of a catchment’s average annual runoff, and so of its nitrogen and phosphorus load, is removed from the surface discharge when stored stormwater (in a pond or underground storage) is pumped out and used, usually for irrigation. Open it from a catchment whose treatment is Stormwater Harvesting. You enter three things: how fast the water is used, how much storage can be drawn down, and the area it is used on. Everything else comes from the catchment.
Description
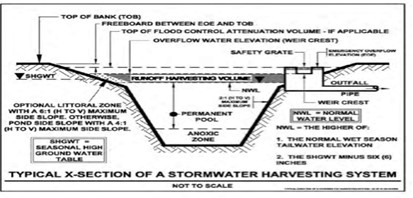
Stormwater harvesting systems use treated stormwater from a catchment for beneficial purposes, reducing the stormwater volume and mass of pollutants discharged from storage areas such as a wet detention pond. It is often used in series with wet detention in the same catchment.
Harvested stormwater can be used for numerous applications, including:
- Irrigating lawns and landscape beds
- Irrigating greenroofs
- Washing vehicles
- Industrial cooling
- Toilet flushing
It can replace potable water used for irrigation, reducing dependence on potable water supplies.
To properly design a stormwater harvesting system that results in a predictable average annual mass removal, water budgets are used. The development of a water budget quantifies the capture of runoff or reduction in off-site discharge over time.
The water budget accounts for:
- Storage volume
- Rate of use
- Discharge
Calculation requires knowledge of:
- Watershed soil and impervious characteristics
- Water use volumes and rates
- Desired percentage of stormwater runoff to be used
- Maximum volume of stormwater runoff storage
- Rainfall data
- Evaporation data
Rainwater or Stormwater Harvesting?
Rainwater Harvesting and Stormwater Harvesting use the same calculations and the same harvesting efficiency (REV) curves. All the calculations and curves are in inches per day (over the Equivalent Impervious Area). The only difference is where the water is collected from:
- Rainwater Harvesting collects only from rooftops. Use it when all the harvest volume can be used.
- Stormwater Harvesting collects from anywhere in the catchment. Using all the harvest volume is not a requirement. The volume harvested can exceed the maximum available volume, because the water is stored in a wet detention facility, which can have additional sources of water (such as groundwater).
Whether the water is used every day or twice per week is not important: the curves work with the average rate of use per day.
Rate-Efficiency-Volume (REV) Curves
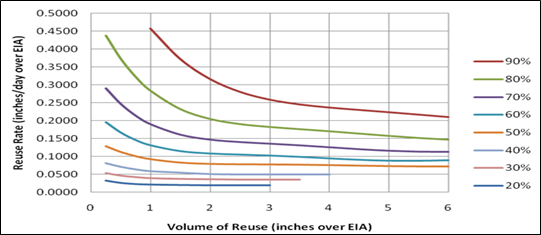
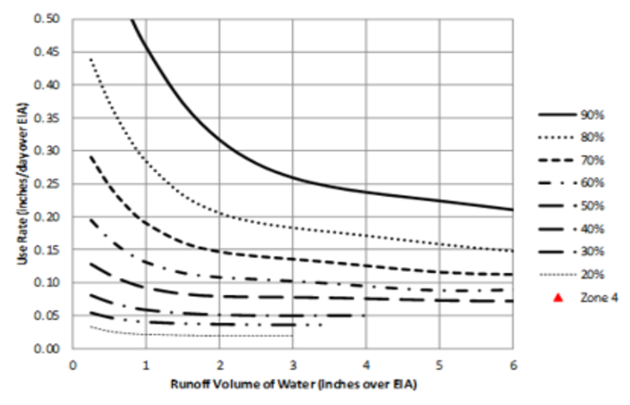
Simulations of runoff and use from stormwater harvesting ponds over long time periods were conducted to determine effectiveness curves known as Rate-Efficiency-Volume (REV) curves.
REV curves are used to assess nutrient removal effectiveness.
Applicant’s Handbook reference
Appendix O, Table 1 (BMP Efficiencies), Stormwater harvesting: the credit is the annual load of stormwater “not discharged because used for irrigation”, evaluated case by case with “the rate-efficiency-volume [REV] curve methodology used by DEP” (Wanielista et al. 1991; Wanielista and Bradner 1992); BMPFast reads the harvest efficiency from those REV curves for the project’s zone and applies it to the N and P loads.
Section 2.0 Definitions and Terms, “Stormwater harvesting”: “capturing stormwater for irrigation or other beneficial use”; this is the use the worksheet credits.
Important assumptions when using REV curves:
- Net groundwater movement into or out of the storage (pond) is assumed to be zero in a year.
- The use rate is the annual average and is presented on REV curves as an average rate per day over the Equivalent Impervious Area (EIA).
- Beneficial use of water from the pond occurs twice per week, with no water use the day after rainfall, and is equal to or greater than the daily water amount. A sensitivity analysis showed less than one percent change in effectiveness, so whether the water is used every day or twice per week is not important.
- Rainfall on a wet pond equals evaporation from the wet pond in a year.
- Effectiveness results (REV curves) are long-term averages based on historical rainfall. Annual values vary.
- Drawdown of the permanent pool for beneficial use does not exceed 1 inch over the catchment to protect vegetation and aesthetics.
Source reference
Harper, G.M. (1991). Design Curves for the Reuse of Stormwater. M.S. thesis, University of Central Florida; the same curves in Wanielista, M.P., Yousef, Y.A., Harper, G.M. and Dansereau, L. (1991), Design Curves for the Reuse of Stormwater (link): long-term simulations of a harvesting pond with historical rainfall give, for each zone, curves of the use rate needed for each harvest efficiency at each storage volume (both over the equivalent impervious area); the simulations assume no net groundwater exchange, rain on the pond equal to evaporation, use twice a week and at most 1 in of drawdown.
Storage Configurations
Various storage devices and physical arrangements are used.
If storage is underground:
- No evaporation
- No rainfall directly into storage
- No net groundwater exchange
Storage volume equals the volume of water used.
REV assumptions for surface ponds are applied to underground systems and provide reasonable runoff removal estimates.
Cooling and Wash Water Applications
Pond storage is often used for cooling water or vehicle wash water. Many such systems require a separate holding vessel with specific design volume.
This is typically supplied by pumping from stormwater storage twice per week.
Cooling or wash water use is converted from average gallons per week into:
- Inches per day
- Over the Equivalent Impervious Area (EIA)
Standard conversion factors are used.
Average effectiveness must consider:
Storage device effectiveness + REV effectiveness (series configuration).
Series Removal Example
Example:
- 100 kg/year input
- 40 kg/year removed in wet detention
- 50% of the remaining 60 kg/year is removed by harvesting
Overall removal:
40 + 0.50(60) = 70 kg/year
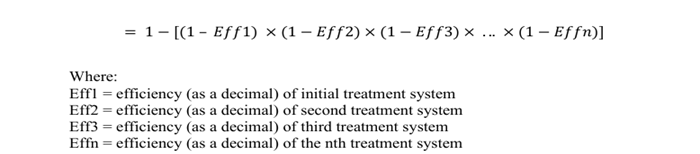
The general series removal equation is found in the Applicant’s Handbook Vol 1, Section 9 (June 28, 2024).
Applicant’s Handbook reference
Section 9.5.1 Treatment Train Nutrient Reduction (Equation 9-5): BMPs in series are combined as 1 − [(1 − Eff1) × (1 − Eff2) × …], each acting on the load the one before it leaves; BMPFast combines a wet pond and harvesting in the same catchment this way, as in the example.
Inputs
| Input | Units | What it means / how it is used |
|---|---|---|
| Harvest Rate (0.1 – 4.0 in/week) | in/week | The average annual rate of use, in inches per week over the irrigation area (tooltip: “0.1 – 4.0 inches/week over Irrigation Area”). Typical irrigation rates in Florida are 0.5 to 1.5 inches per week (annual average). The range in the label is the range of the REV curves; the form does not stop a value outside it. |
| Max Available Harvest Volume (ac-ft): | ac-ft | The storage that can be drawn down for use, measured from the discharge elevation (tooltip). It may be in a pond or in underground storage. Enter it in acre-feet. |
| Area Available for Irrigation (ac): | acres | The area the harvested water is applied to. With the Harvest Rate it fixes the volume used. |
Not entered here: the rainfall zone (one set of REV curves per zone), the annual rainfall, the catchment area and its annual runoff coefficient (ROC), and the N and P loads all come from the catchment and project. The harvesting system normally draws only on its own catchment’s runoff: flows routed from upstream catchments bypass it and go on, untreated, to the next catchment. Should one of them be designed to treat the upstream runoff too, untick Bypass upstream runoff on this catchment’s Routing screen (BMPFast asks once when a catchment is first routed into it).
Irrigation area × irrigation rate = harvested volume. A volume in gallons must be converted to acre-feet (325,851 gallons per acre-foot) before it is entered.
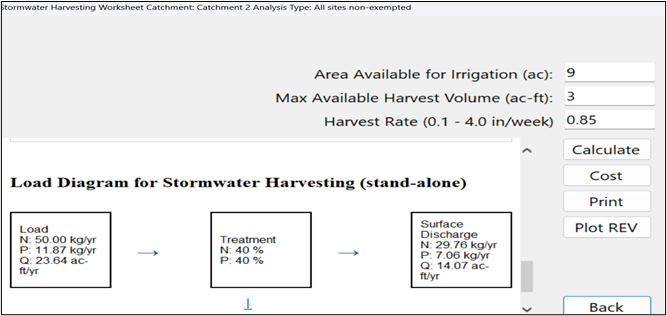
Results
After Calculate, the right-hand pane shows the report:
- Stormwater Harvesting Input Variables — Contributing Area to BMP (ac), Total Area Available for Irrigation (acres), Available Harvest Volume (ac-ft), Available Harvest Rate (in/week), Effective Impervious Area (acres; catchment area × ROC) and Treatment Depth (in).
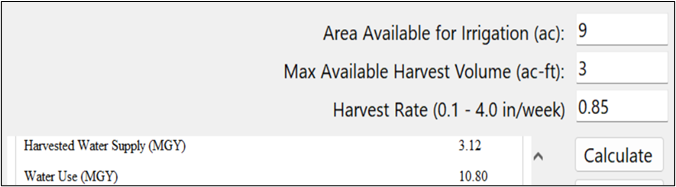
- Water Budget — Water Use (MGY), Harvested Water Supply (MGY) and Supplemental Water Needed (MGY).
- Watershed Characteristics — Watershed Area, Contributing Area to BMP, Non-DCIA Curve Number, DCIA Percent, Rainfall Zone and Rainfall, from the catchment.
- Surface Water Discharge — Provided Nitrogen and Provided Phosphorus Treatment Efficiency (%). Both equal the Harvest Efficiency.
- Surface Discharge Load Diagram — Load in (N and P, kg/yr; runoff Q, ac-ft/yr), Treatment (N and P %), Surface Discharge (N, P, and Q reduced by the Harvest Efficiency), and Mass Reduction (N and P, kg/yr). The diagram is for this catchment on its own; no routing is done here.
Harvested Water Supply is the runoff actually harvested in an average year: annual runoff volume × Harvest Efficiency, in million gallons per year. Water Use is the use set by the inputs: Harvest Rate × 52 weeks × Irrigation Area, in million gallons per year. Supplemental Water Needed is Water Use − Harvested Water Supply, or 0 when the harvest covers the use: the water that must come from another source (the pond can have other sources, such as groundwater). These values can be used for consumptive use permits and water use permits. Treatment Depth is the retention depth that would give the same efficiency in the retention tables, so the harvesting system can be compared with retention.
The status strip along the bottom of the window shows the project’s Maximum % Removal for TN and TP, the targets to compare the result against.
Buttons
| Button | What it does |
|---|---|
| Calculate / Equations / Report | When any input has changed since the report was shown, the button reads Calculate: a click reads the boxes, calculates and shows the report. Once the report is current, the button switches the pane between the Equations page and the Report. |
| Opens what the pane is showing (report or Equations page) in the Report Viewer, from where it can be printed. | |
| Back | Keeps the values typed in the boxes, calculates, marks the project as changed and closes the worksheet. |
| Plot REV | Opens the REV Curve Plot for the project’s rainfall zone, with this design marked on it (see below). |
| Sizing | Opens the Sizing form, where Available Harvest Volume (ac-ft), Total Area Available for Irrigation and Available Harvest Rate can be stepped or plotted against the N and P removal targets. Apply keeps the values on the BMP; Cancel discards them. The part of a curve beyond the REV design curves is dotted: more volume gives no more efficiency there. See Sizing. |
| Cost | Opens the life-cycle Cost Analysis for this BMP. For Stormwater Harvesting the routine-cost list includes a Stormwater Resale credit, its quantity pre-filled from the Harvested Water Supply (MGY). |
| Help | Opens this page. |
Equations
Methodology. Harvesting and Greenroof Methodology explains the REV curves and how BMPFast reads them, with a worked example and the curves for each zone.
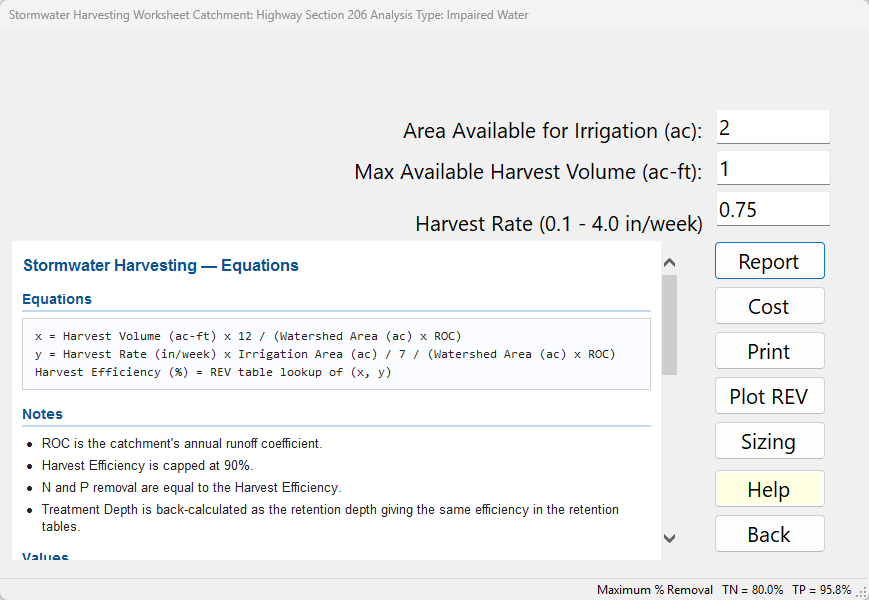
These are the equations the program applies (also shown on the Equations page, with the current values).
x (in over EIA) = Harvest Volume (ac-ft) x 12 / (Watershed Area (ac) x ROC)
y (in/day over EIA) = Harvest Rate (in/week) x Irrigation Area (ac) / 7 / (Watershed Area (ac) x ROC)
Harvest Efficiency (%) = REV table lookup of (x, y)
Harvested Water Supply (MGY) = Annual Runoff Volume (ac-ft/yr) x Harvest Efficiency / 100 x 0.32585
Water Use (MGY) = Harvest Rate (in/week) x 52 x Irrigation Area (ac) x 43560 / 12 x 7.48052 / 1,000,000
Supplemental Water Needed (MGY) = Water Use - Harvested Water Supply (never below 0)- ROC is the catchment’s annual runoff coefficient; Watershed Area × ROC is the Equivalent Impervious Area (EIA).
- An x beyond the last column of the REV table (6 in over EIA) is treated as 6 in: more storage beyond the curves gives no further efficiency. Each REV curve ends before 6 in (the low-efficiency curves stop between about 1.8 and 5 in); from a curve’s end to 6 in, its final value is used.
- Harvest Efficiency is capped at 90% and is never less than 0. Below 20%, the lowest REV curve, BMPFast extends the line between the 20% and 30% curves, beyond the published curves (Wanielista, 2009); the value is kept, and the report says so in a note under the input table. Treat such a value as an estimate.
- N and P removal, and the hydraulic capture, are equal to the Harvest Efficiency.
- Treatment Depth is back-calculated as the retention depth giving the same efficiency in the retention tables.
- The Values table on the Equations page lists Non-DCIA Curve Number, DCIA Percent and Treatment Rate, as it does for every retention-type BMP. They do not enter the harvest efficiency, which comes from the REV curves of the Rainfall Zone; CN and DCIA are used only to back-calculate the Treatment Depth. The Equations page says so in its notes.
Plot REV Option
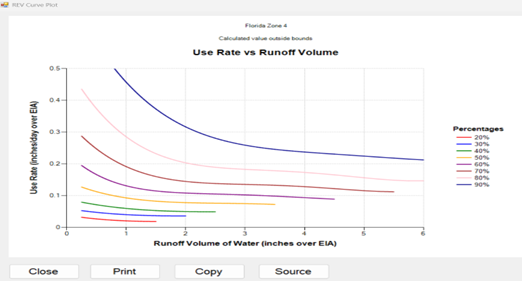
The Plot REV button opens the REV Curve Plot window, which can be used for discovery analysis. It draws the Use Rate (inches/day over EIA) against the Runoff Volume of Water (inches over EIA) for removal efficiencies of 20% to 90% in the project’s rainfall zone, and marks this design’s point (x, y). If the point is outside the chart (x of 6 or more, or y of 0.5 or more) the chart says “Calculated value outside bounds”. Where a curve ends before 6 in, a dashed line in the same color carries its final value on to 6 in: that is the value the program uses there.
The software uses a polynomial curve fit to give the combinations of use rate and harvested volume. Curves are not perfectly smooth because they are polynomial fits, and each is drawn only up to its fitted limit. The curves show the marginal change in use rate and harvested volume, allowing optimization based on cost or other factors.
The window’s buttons: Close; Print; Copy (copies the chart, or the source curves when they are showing, to the clipboard); and Source, which replaces the chart with the source REV curves for the rainfall zone. Click it again (it then reads “Show Chart Plot”) to return to the chart.
Source Curves
The source curves shown by the Source button are from:
Wanielista, M. P., Yousef, Y. A., Harper, G. M., & Dansereau, L. (1991). Design Curves for the Reuse of Stormwater. stormwater.ucf.edu/research/FILES/Wanielista
There is one set of curves per zone, representing the average of the rainfall station simulations within that zone.
Source reference
Wanielista, M.P. (2009). Review of the REV Curves. Memorandum, May 20, 2009, Stormwater Management Academy, University of Central Florida: fits each REV curve with a fifth-order polynomial, adds curves down to 20 %, drops the 95 % curve, and limits the curves to 0.25 to 6 in of storage (1 to 6 in for the 90 % curve); BMPFast builds its table from these polynomials.
BMPFast method (Harvesting, StormwaterHarvesting and RainwaterHarvesting classes; below 20 % decided by Ron, 2026-10-13): the efficiency is capped at 90 %, the highest curve the memorandum keeps; past a curve’s fit limit its last value is held out to 6 in; storage below 0.25 in is read at 0.25 in; and below the 20 % curve the line between the 20 % and 30 % curves is extended, beyond the published curves.
Runoff Coefficient (ROC) Consideration
Early software releases assumed:
ROC = 0.8
This overestimated water use to be conservative for permit applications.
Example comparison:
- ROC = 0.325 → 7.673 MGY
- ROC = 0.8 → 12.83 MGY
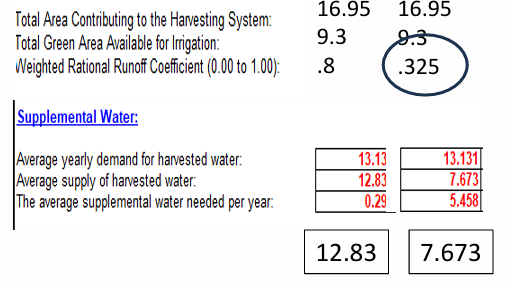
With publication of ROC values in Applicant’s Handbook Vol 1, Appendix N, more accurate harvested volume calculations are now used.
Applicant’s Handbook reference
Section 9.2.1 Calculating Predevelopment and Post-development Hydrology: the annual runoff coefficient (ROC) is read from Appendix N for the zone, non-DCIA curve number and DCIA, with linear interpolation; BMPFast uses the catchment’s ROC to find the Equivalent Impervious Area (catchment area × ROC) on which the REV curves are read.
Appendix N (Mean Annual Runoff Coefficients (ROC Value) as a Function of DCIA Percentage and Non-DCIA Curve Number): one table for each of Zones 1 to 5; these are the ROC tables BMPFast uses.
This results in improved estimates of:
Source reference
FDEP and the water management districts (2010). Stormwater Quality Applicant’s Handbook: Design Requirements for Stormwater Treatment Systems in Florida, March 2010 draft (not adopted), Section 15.3 Equivalent Impervious Area (Equation 15-1) (the draft, not adopted: PDF, 16 MB): the equivalent impervious area is the watershed area times its weighted runoff coefficient; BMPFast uses the catchment’s annual runoff coefficient (ROC) as that coefficient.
- Capture
- Water supply
- Water use
Further guidance on consumptive use and water use permits can be found in:
- Applicant’s Handbook for Water Use Permit Applications
- SFWMD (June 13, 2022)
- SWFWMD (May 2014)
- SJRWMD (August 2014)
Sample problems
Worked problems solved in BMPFast, each with every input, the steps with screen captures, the program’s results, a hand check and the project file to download. Captures are for demonstration only. All of them: BMPFast sample problems.