
All programs › BMPFast › BMPFast 2 sample problems
Routing: retention basins in series, three methods
Three catchments one into another, each with a retention basin; Treatment Depth Allocation, Equation 9-5 and v1’s Treatment Depths added, compared (BMPFast 2).
Help: Strand Based Routing for Retention in Series (help page 4824) · Download the .bmpf
1The problem
Three catchments drain one into another, Upstream subdivision → Middle subdivision → Downstream commercial → outlet, and each has its own dry retention basin. When retention basins are routed in series, BMPFast 2 lets you choose how the run of basins is calculated (the routing’s Retention basins in series). Make one routing for each of the three methods and compare them.
| Input | Value | Source |
|---|---|---|
| Project (General Site Information) | ||
| Meteorological zone | Florida Zone 4 | Zone map (help page 815) |
| Mean annual rainfall | 52 in | Mean annual rainfall map (help page 815) |
| Performance standard (analysis type) | All sites non-exempted | Site (illustrative; the catchments of BMPFast sample project Detention Multiple catchments 2020 Manual pages 190 196) |
| Catchment 1: Upstream subdivision (Watershed Characteristics) | ||
| Land use, pre / post | Agricultural - Citrus / User Defined Values | Site (illustrative; the catchments of BMPFast sample project Detention Multiple catchments 2020 Manual pages 190 196) |
| Area, pre / post | 20.75 / 20.75 ac | Site (illustrative; the catchments of BMPFast sample project Detention Multiple catchments 2020 Manual pages 190 196) |
| Non-DCIA curve number, pre / post | 68.3 / 76.12 | Site (illustrative; the catchments of BMPFast sample project Detention Multiple catchments 2020 Manual pages 190 196) |
| DCIA, pre / post | 0 / 17.9 % | Site (illustrative; the catchments of BMPFast sample project Detention Multiple catchments 2020 Manual pages 190 196) |
| EMC TN, pre / post | 2.110 / 1.816 mg/L | BMPFast land use table (AH Vol I Table 9.2) |
| EMC TP, pre / post | 0.180 / 0.453 mg/L | BMPFast land use table (AH Vol I Table 9.2) |
| Catchment 2: Middle subdivision (Watershed Characteristics) | ||
| Land use, pre / post | Agricultural - Citrus / User Defined Values | Site (illustrative; the catchments of BMPFast sample project Detention Multiple catchments 2020 Manual pages 190 196) |
| Area, pre / post | 25.13 / 25.13 ac | Site (illustrative; the catchments of BMPFast sample project Detention Multiple catchments 2020 Manual pages 190 196) |
| Non-DCIA curve number, pre / post | 68.3 / 76.12 | Site (illustrative; the catchments of BMPFast sample project Detention Multiple catchments 2020 Manual pages 190 196) |
| DCIA, pre / post | 0 / 17.8 % | Site (illustrative; the catchments of BMPFast sample project Detention Multiple catchments 2020 Manual pages 190 196) |
| EMC TN, pre / post | 2.110 / 1.715 mg/L | BMPFast land use table (AH Vol I Table 9.2) |
| EMC TP, pre / post | 0.180 / 0.407 mg/L | BMPFast land use table (AH Vol I Table 9.2) |
| Catchment 3: Downstream commercial (Watershed Characteristics) | ||
| Land use, pre / post | Agricultural - Citrus / User Defined Values | Site (illustrative; the catchments of BMPFast sample project Detention Multiple catchments 2020 Manual pages 190 196) |
| Area, pre / post | 37.41 / 37.41 ac | Site (illustrative; the catchments of BMPFast sample project Detention Multiple catchments 2020 Manual pages 190 196) |
| Non-DCIA curve number, pre / post | 68.3 / 84 | Site (illustrative; the catchments of BMPFast sample project Detention Multiple catchments 2020 Manual pages 190 196) |
| DCIA, pre / post | 0 / 19 % | Site (illustrative; the catchments of BMPFast sample project Detention Multiple catchments 2020 Manual pages 190 196) |
| EMC TN, pre / post | 2.110 / 1.816 mg/L | BMPFast land use table (AH Vol I Table 9.2) |
| EMC TP, pre / post | 0.180 / 0.453 mg/L | BMPFast land use table (AH Vol I Table 9.2) |
| Treatments (one in each catchment) | ||
| Upstream subdivision | Retention basin, 0.865 ac-ft (treatment depth 0.500 in), recovers in 72 hours | Design (illustrative) |
| Middle subdivision | Retention basin, 0.838 ac-ft (treatment depth 0.400 in), recovers in 72 hours | Design (illustrative) |
| Downstream commercial | Retention basin, 1.870 ac-ft (treatment depth 0.600 in), recovers in 72 hours | Design (illustrative) |
Find: the removal of the site by each method, side by side, and which method BMPFast (v1) uses.
2Steps in BMPFast 2
Start BMPFast 2 and choose File ▸ New project. The tree on the left opens on the project (General Site Information). On its Entry tab enter: Project name Retention basins routed in series; Meteorological zone Florida Zone 4; Mean annual rainfall 52.00 in; Type of analysis All sites non-exempted. (To follow along with the finished project instead, choose File ▸ Open and open
routing-retention-in-series.bmpffrom Files below.)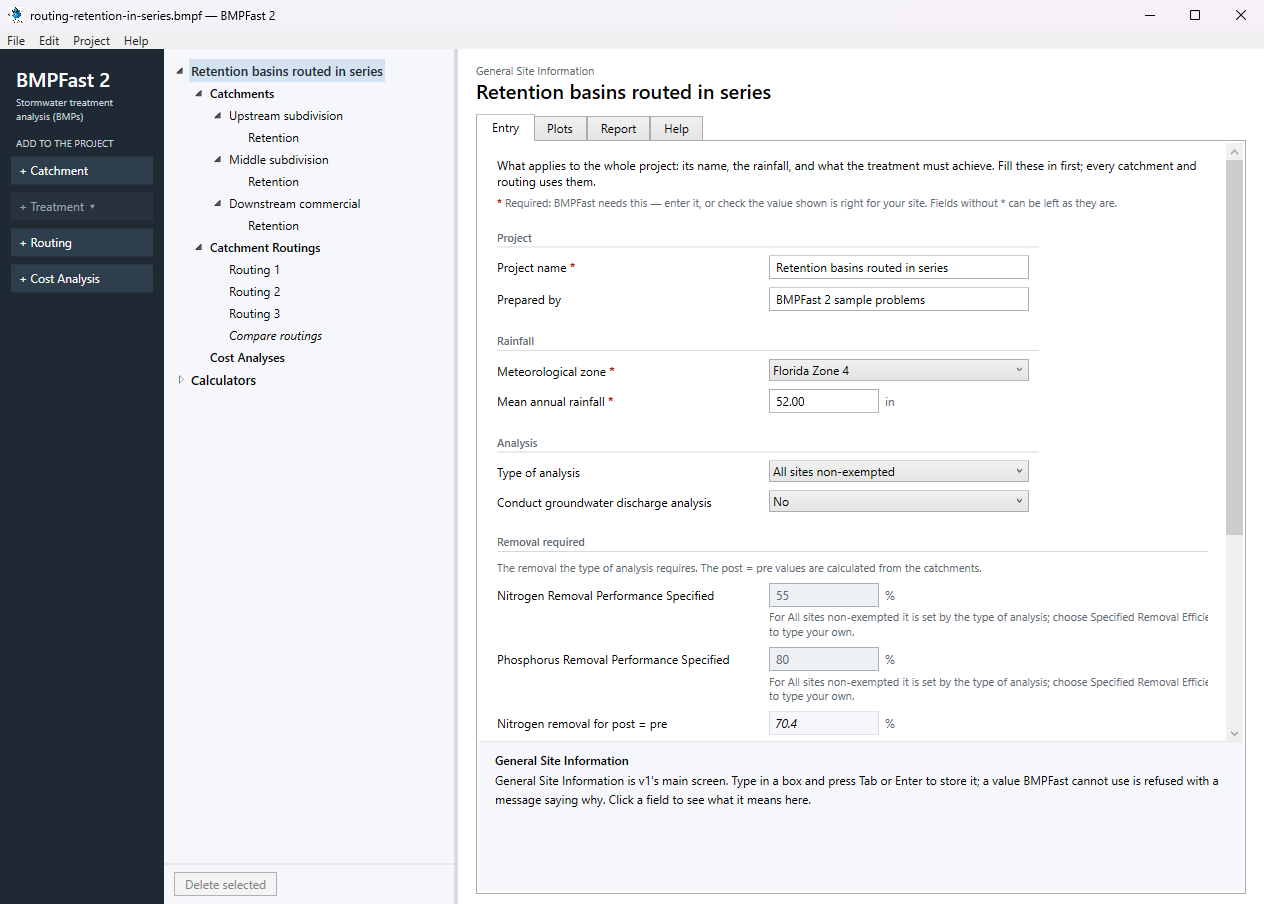
General Site Information: the project’s Entry tab. Press Add Catchment (left). Select the new catchment in the tree; on its Entry tab type the name Upstream subdivision and enter: Land use (pre) Agricultural - Citrus; Land use (post) User Defined Values; Area (pre) 20.75 ac; Area (post) 20.75 ac; Non-DCIA curve number (pre) 68.30; Non-DCIA curve number (post) 76.12; DCIA (post) 17.90 %; Nitrogen EMC (post) 1.816 mg/L; Phosphorus EMC (post) 0.453 mg/L. Leave the other boxes as they are (0 or blank). BMPFast 2 calculates as you type; scroll down to Calculated for the results after development: Annual runoff coefficient (ROC) (post) 0.232; Runoff volume (post) 20.871 ac-ft/yr; Nitrogen load (post) 46.733 kg/yr; Phosphorus load (post) 11.658 kg/yr.
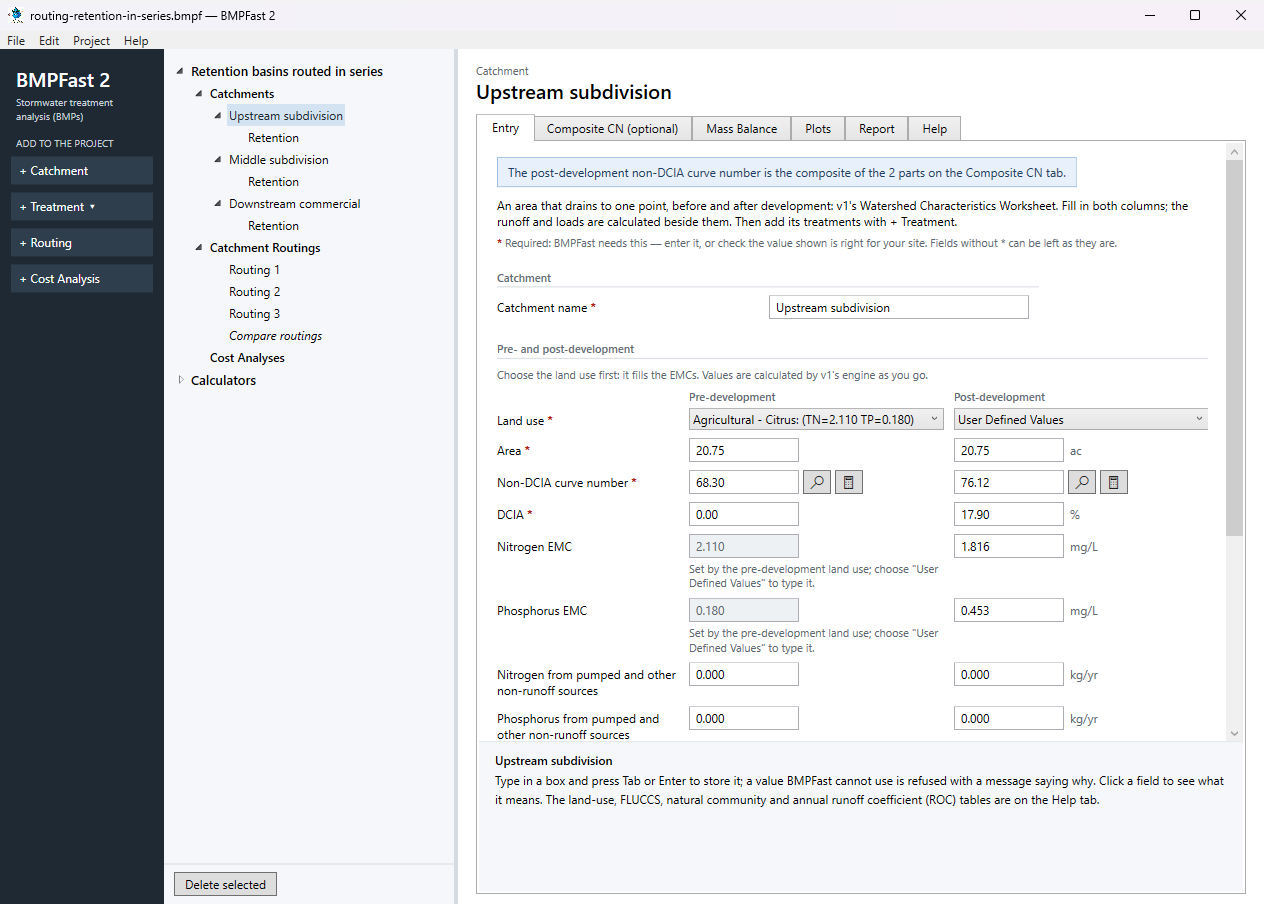
The catchment Upstream subdivision: its Entry tab. With Upstream subdivision selected, press Add Treatment and choose Retention. On its Entry tab type the Treatment name Retention (BMPFast 2 starts it as “Retention 1”) and enter: Provided retention volume 0.865 ac-ft. The results are calculated as you type: Treatment depth 0.500 in; Nitrogen removal provided 65.38 %; Phosphorus removal provided 65.38 %.
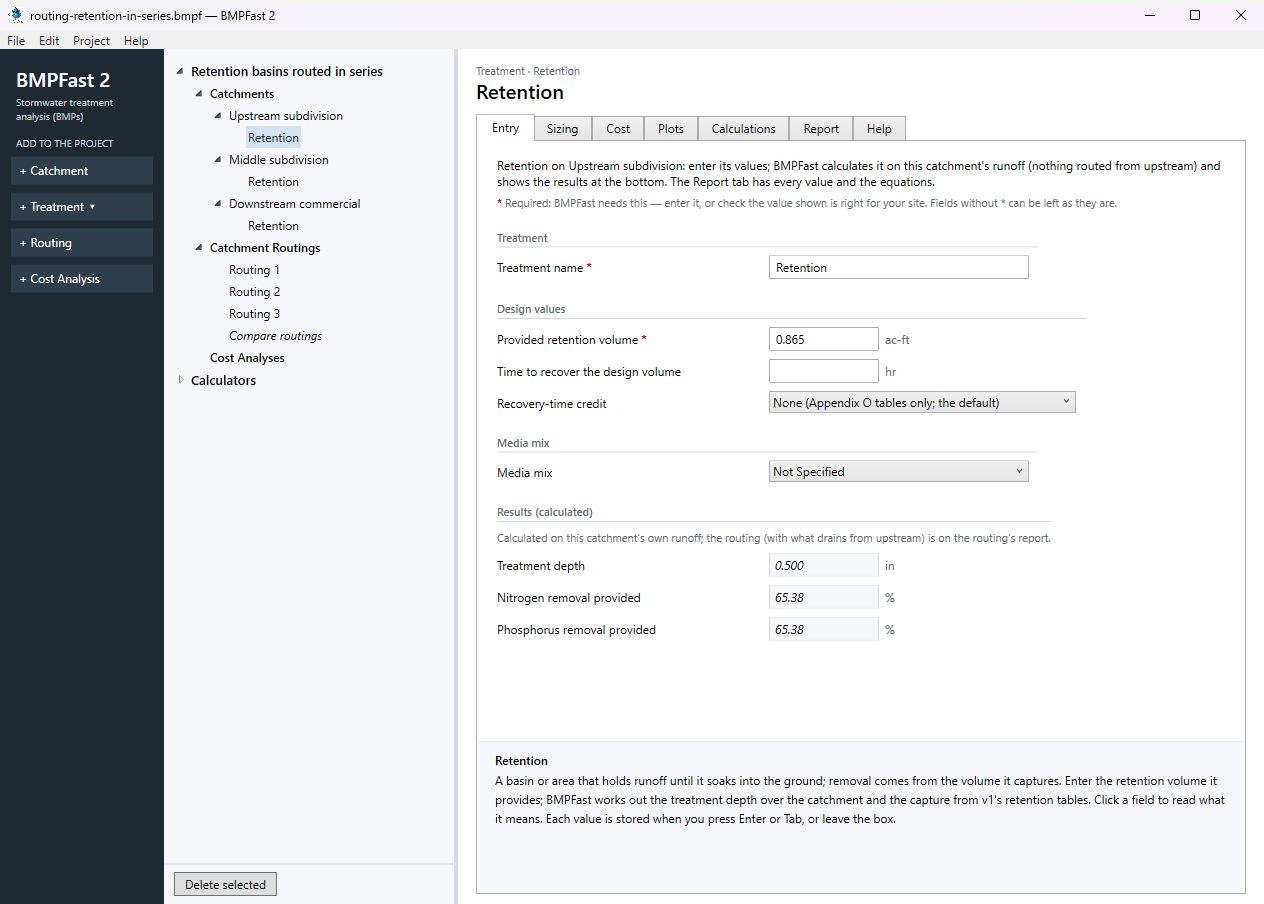
The treatment Retention: its Entry tab. Open the treatment’s Report tab: its inputs and removal in this catchment, as a report to print or save.
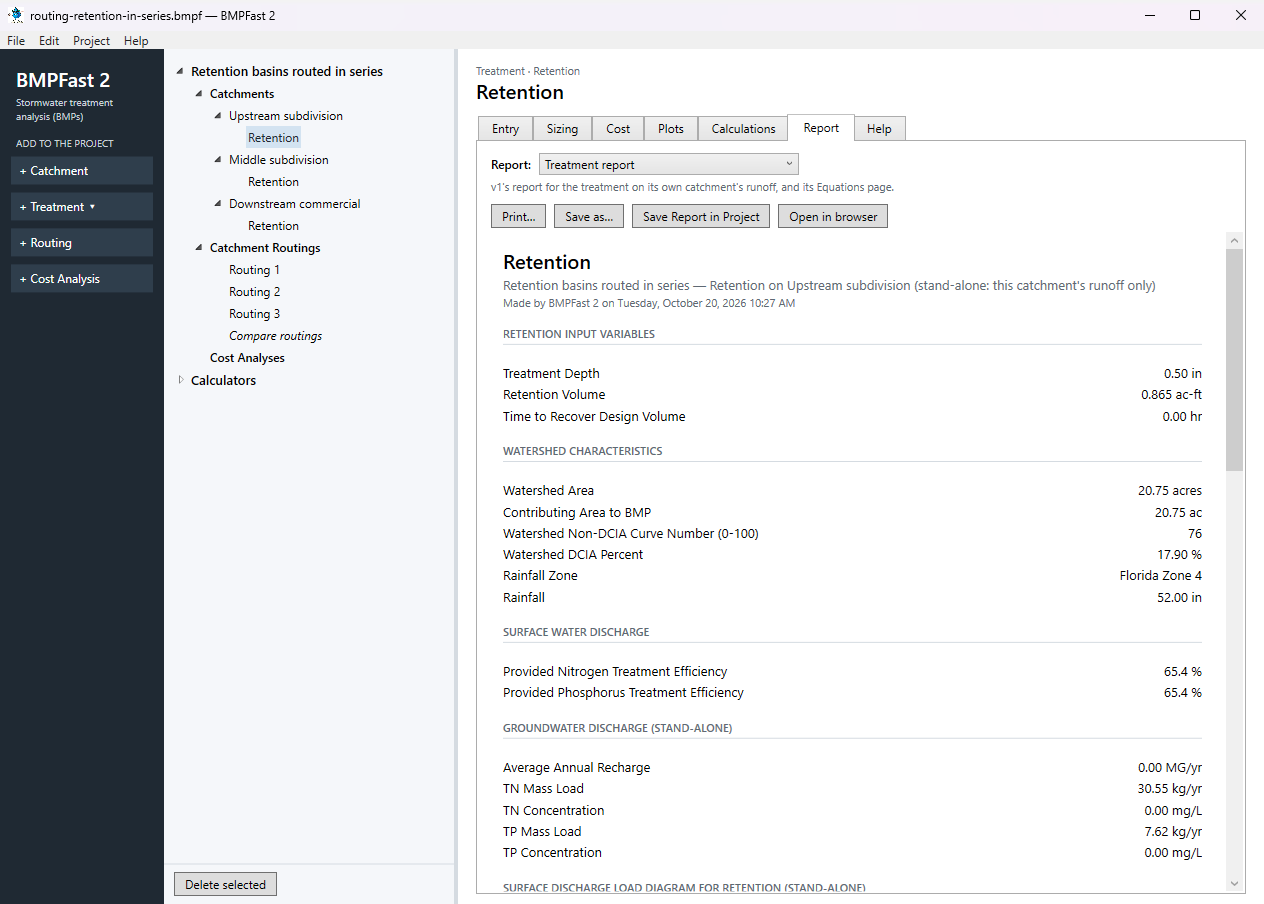
The treatment Retention: its Report tab. Press Add Catchment (left). Select the new catchment in the tree; on its Entry tab type the name Middle subdivision and enter: Land use (pre) Agricultural - Citrus; Land use (post) User Defined Values; Area (pre) 25.13 ac; Area (post) 25.13 ac; Non-DCIA curve number (pre) 68.30; Non-DCIA curve number (post) 76.12; DCIA (post) 17.80 %; Nitrogen EMC (post) 1.715 mg/L; Phosphorus EMC (post) 0.407 mg/L. Leave the other boxes as they are (0 or blank). BMPFast 2 calculates as you type; scroll down to Calculated for the results after development: Annual runoff coefficient (ROC) (post) 0.231; Runoff volume (post) 25.199 ac-ft/yr; Nitrogen load (post) 53.286 kg/yr; Phosphorus load (post) 12.646 kg/yr.
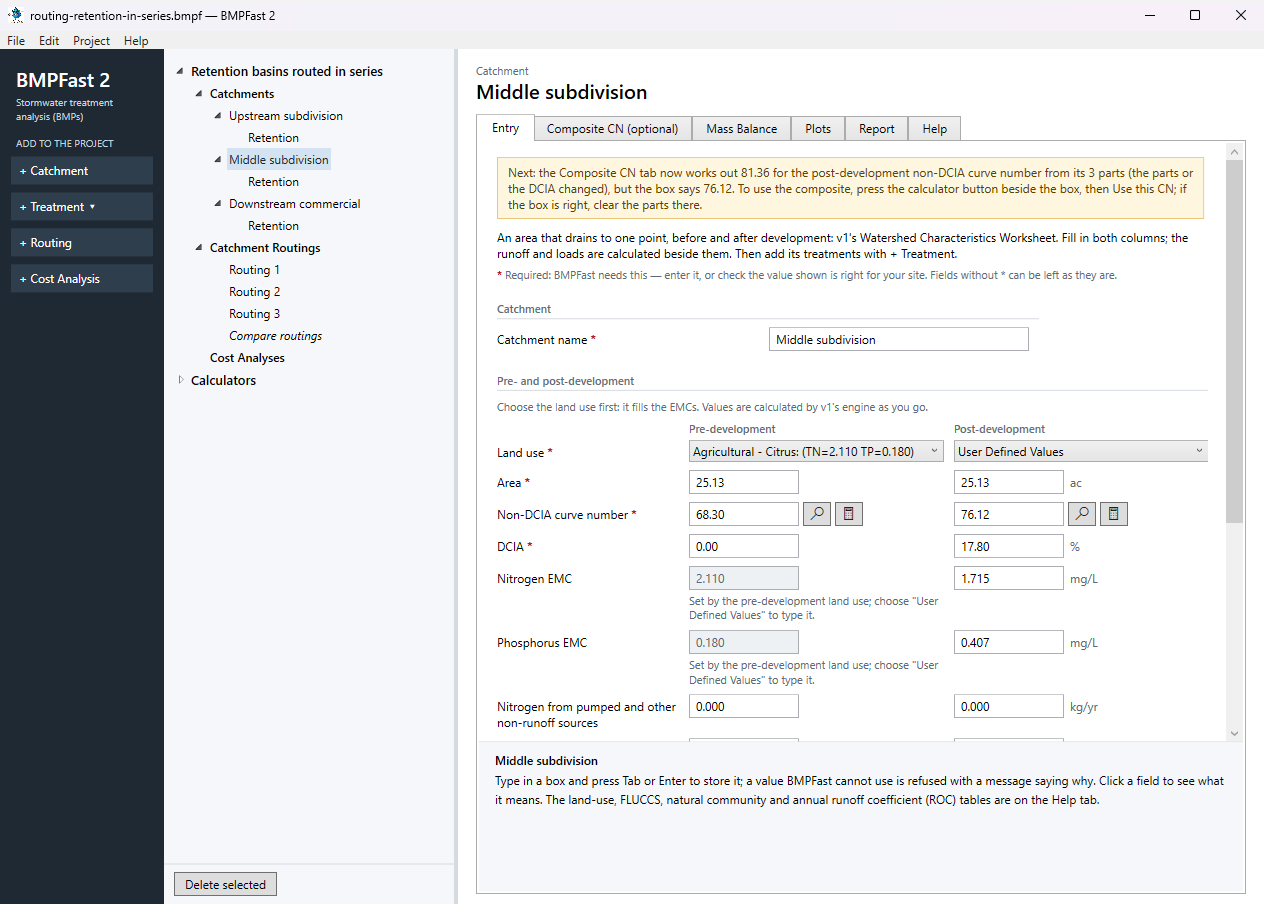
The catchment Middle subdivision: its Entry tab. With Middle subdivision selected, press Add Treatment and choose Retention. On its Entry tab type the Treatment name Retention (BMPFast 2 starts it as “Retention 1”) and enter: Provided retention volume 0.838 ac-ft. The results are calculated as you type: Treatment depth 0.400 in; Nitrogen removal provided 59.13 %; Phosphorus removal provided 59.13 %. These are the treatment alone, on its own catchment’s runoff; the routing calculates it again with the water that drains to it from upstream, so the routing’s numbers below differ.
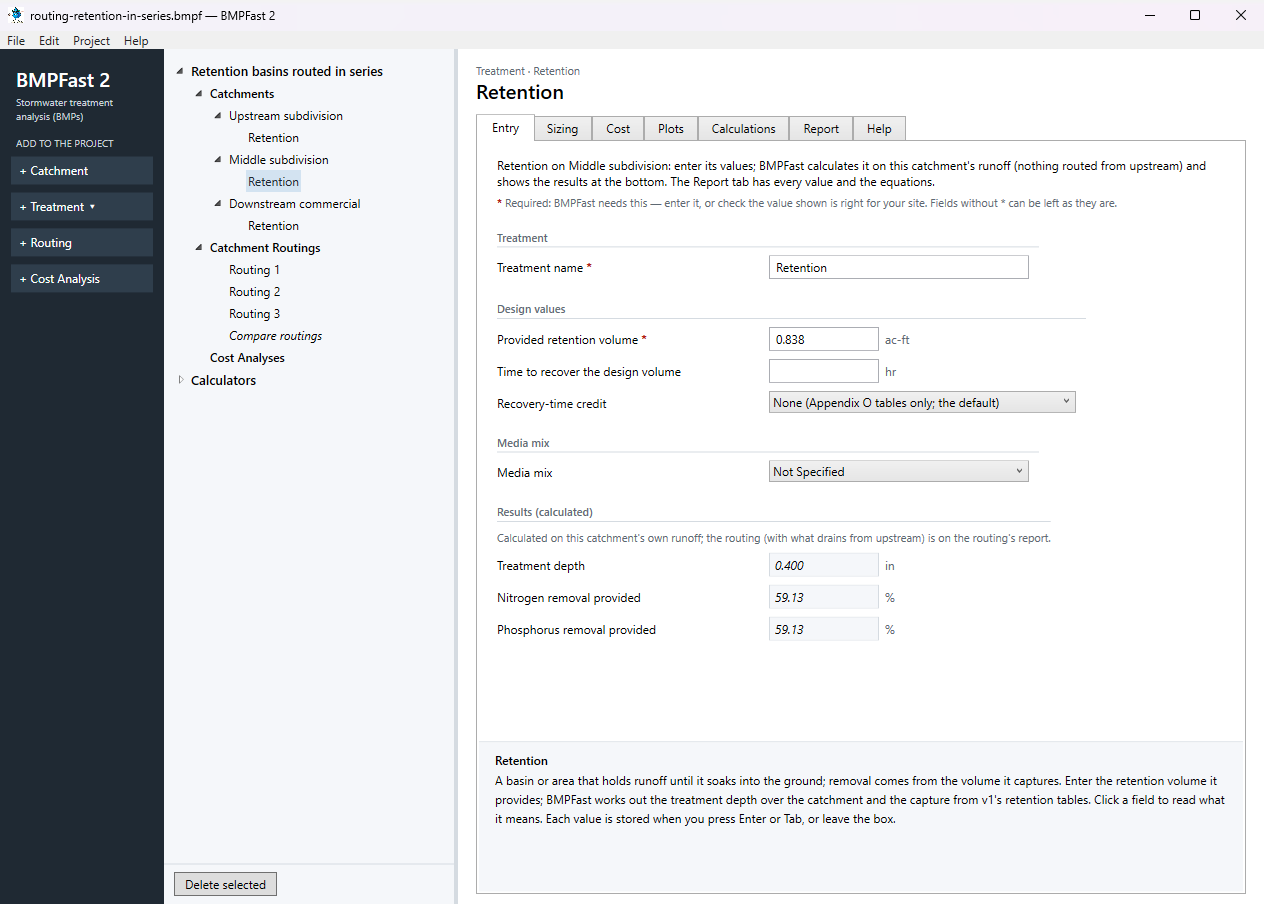
The treatment Retention: its Entry tab. Open the treatment’s Report tab: its inputs and removal in this catchment, as a report to print or save.
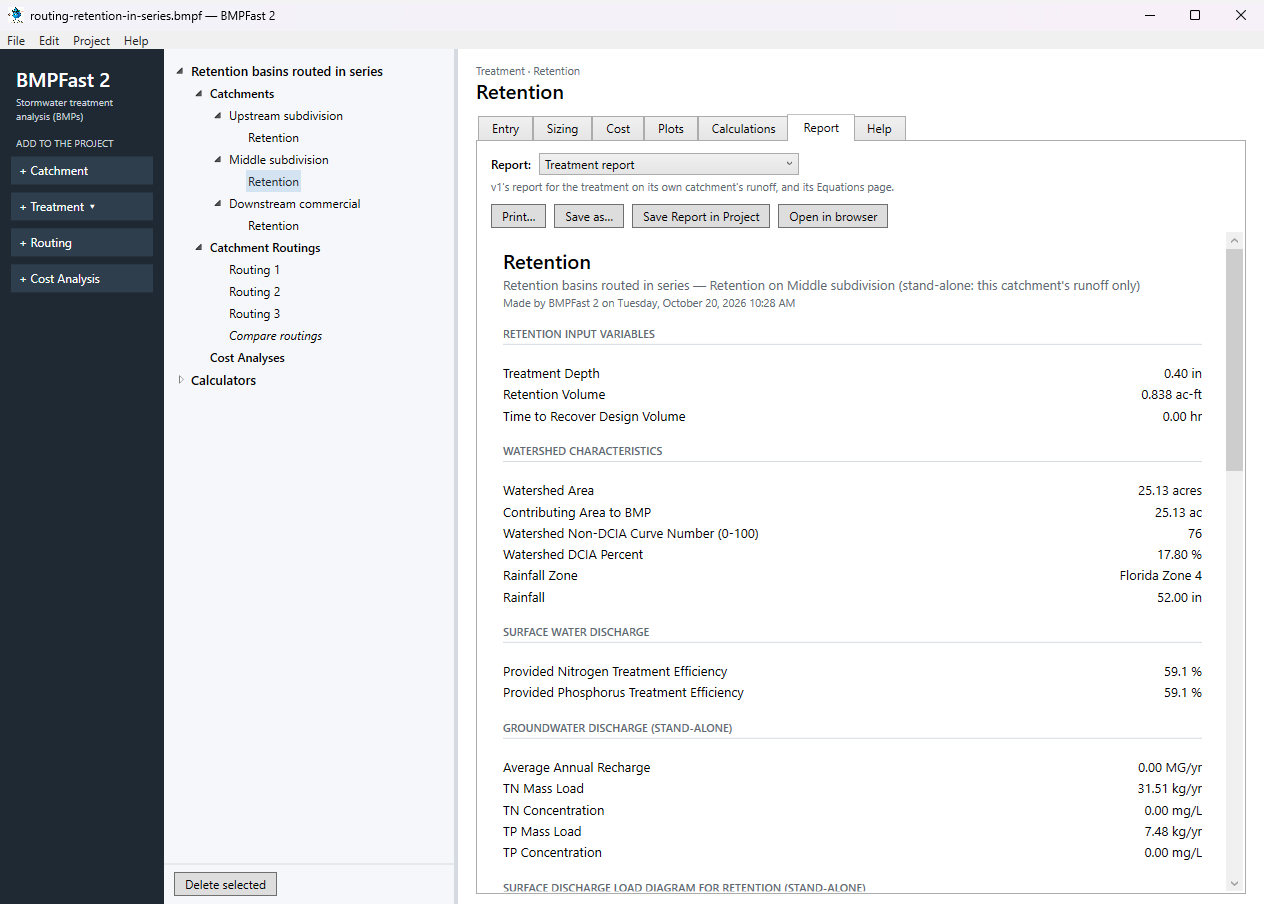
The treatment Retention: its Report tab. Press Add Catchment (left). Select the new catchment in the tree; on its Entry tab type the name Downstream commercial and enter: Land use (pre) Agricultural - Citrus; Land use (post) User Defined Values; Area (pre) 37.41 ac; Area (post) 37.41 ac; Non-DCIA curve number (pre) 68.30; Non-DCIA curve number (post) 84.00; DCIA (post) 19.00 %; Nitrogen EMC (post) 1.816 mg/L; Phosphorus EMC (post) 0.453 mg/L. Leave the other boxes as they are (0 or blank). BMPFast 2 calculates as you type; scroll down to Calculated for the results after development: Annual runoff coefficient (ROC) (post) 0.295; Runoff volume (post) 47.842 ac-ft/yr; Nitrogen load (post) 107.124 kg/yr; Phosphorus load (post) 26.722 kg/yr.
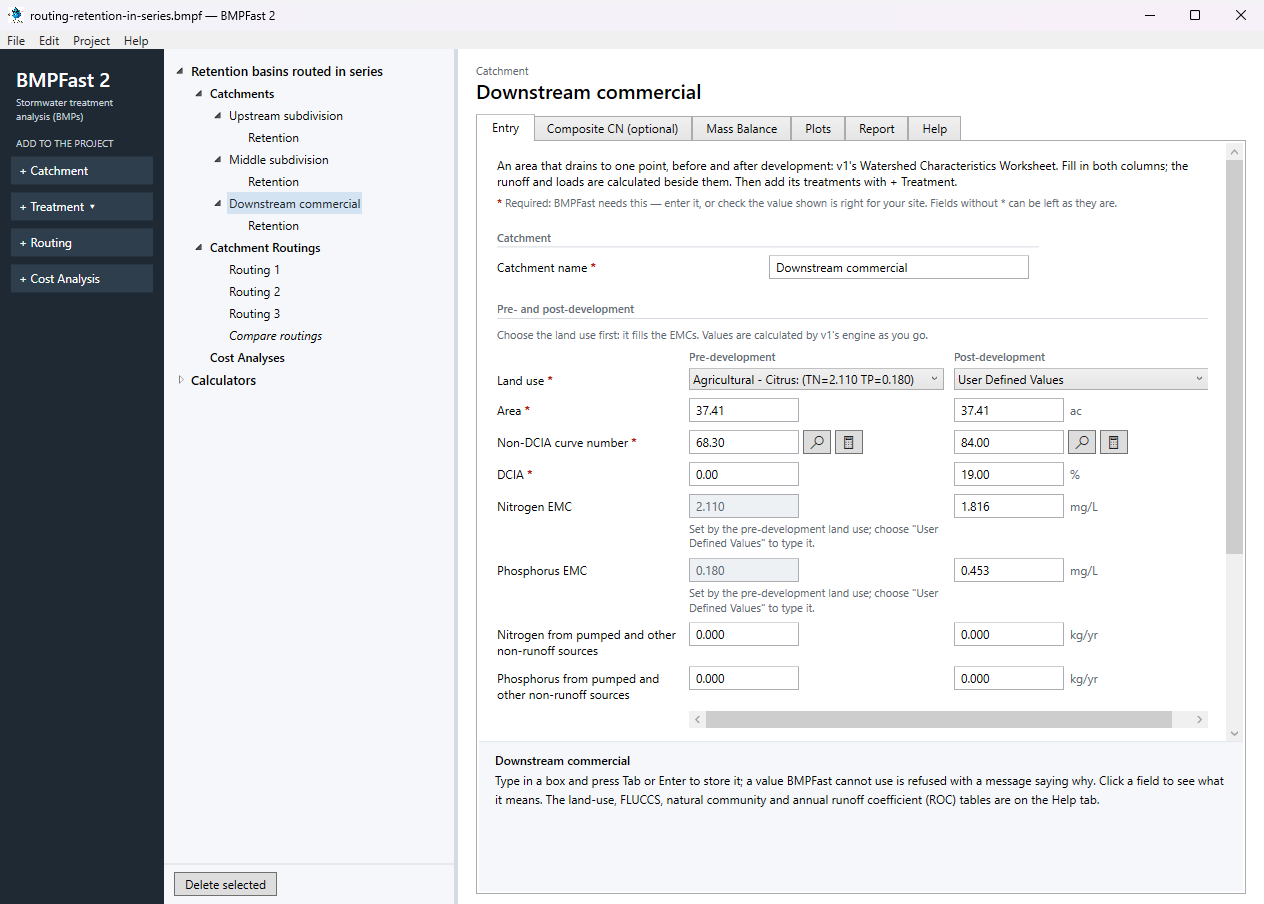
The catchment Downstream commercial: its Entry tab. With Downstream commercial selected, press Add Treatment and choose Retention. On its Entry tab type the Treatment name Retention (BMPFast 2 starts it as “Retention 1”) and enter: Provided retention volume 1.870 ac-ft. The results are calculated as you type: Treatment depth 0.600 in; Nitrogen removal provided 62.37 %; Phosphorus removal provided 62.37 %. These are the treatment alone, on its own catchment’s runoff; the routing calculates it again with the water that drains to it from upstream, so the routing’s numbers below differ.
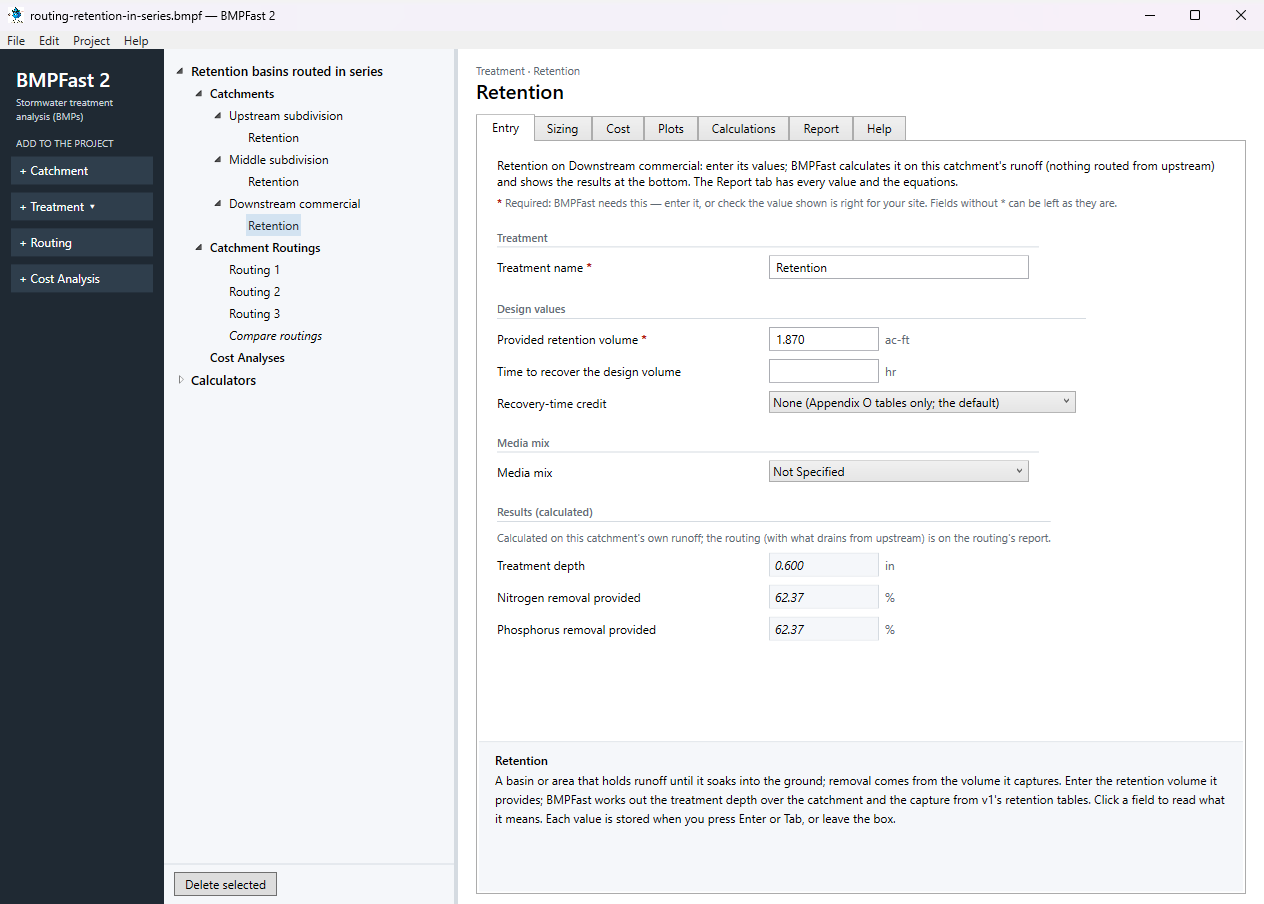
The treatment Retention: its Entry tab. Open the treatment’s Report tab: its inputs and removal in this catchment, as a report to print or save.
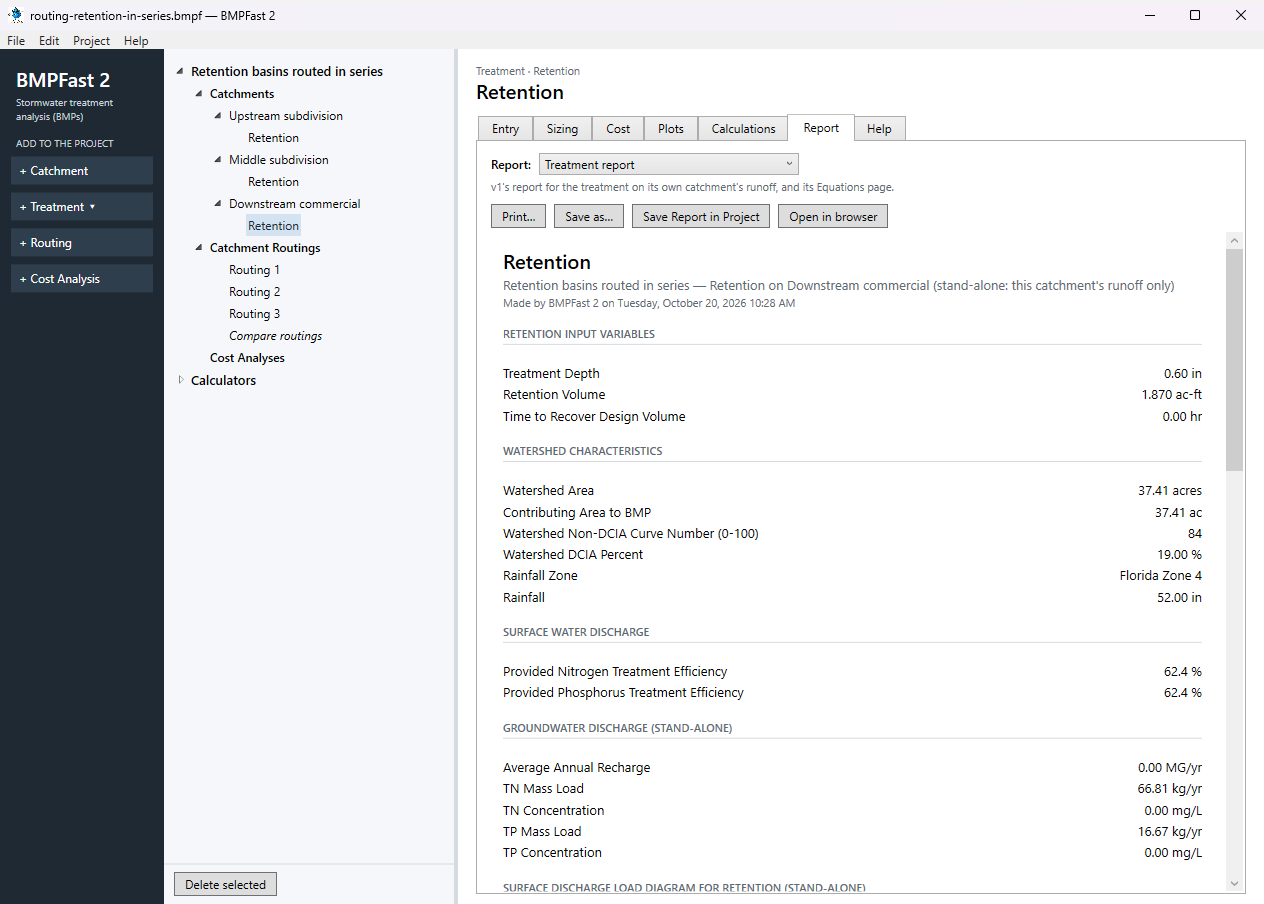
The treatment Retention: its Report tab. Press Add Routing (left). BMPFast 2 adds Routing 1 under Catchment Routings, with every catchment draining to the outlet and no treatment; a project can have several routings, compared side by side. On its Entry tab (How the routing is calculated Strand routing (v1's routing; use this for permits); Retention basins in series Treatment Depth Allocation (each catchment's load at the volume so far over the area so far)) set each catchment as in this table:
Catchment Drains to Treatment used Runoff from upstream catchments Upstream subdivision Middle subdivision Retention Middle subdivision Downstream commercial Retention Treated with this catchment's own runoff Downstream commercial Outlet Retention Treated with this catchment's own runoff A catchment is treated only by the treatment its routing uses.
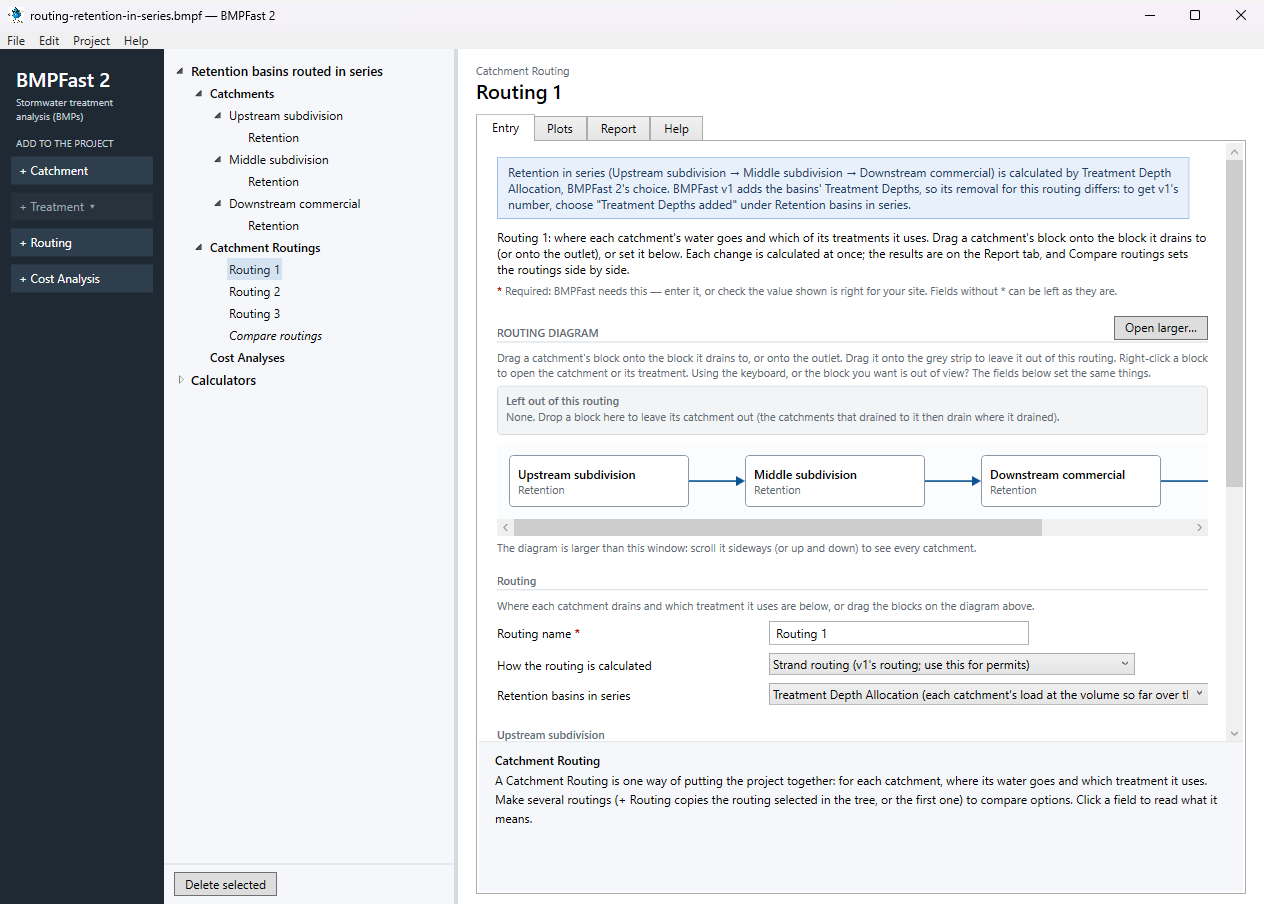
The routing’s Entry tab: where each catchment drains and the treatment it uses. Open the routing’s Report tab. Results shows the loads leaving the site, the removal provided and required, and whether the performance standard is met; the list at the top of the tab has v1’s reports for the same routing (Summary, Complete, Flow Balance, AH Vol I Sec 9 compliance).
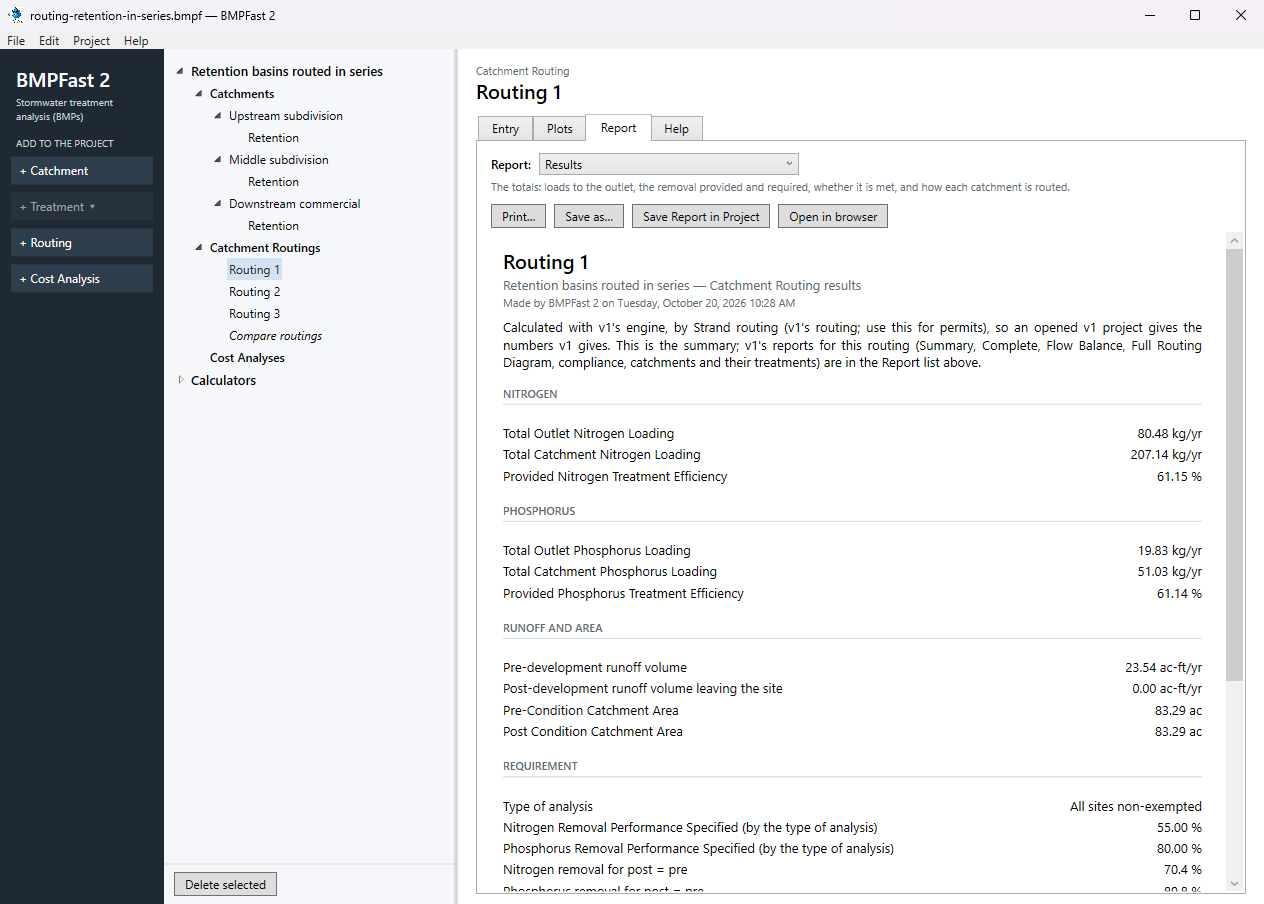
The routing’s Report tab: Results. Select Routing 1 in the tree and press Add Routing: BMPFast 2 adds Routing 2, a copy of Routing 1 (every catchment drains and is treated the same way). On its Entry tab choose Retention basins in series: Efficiencies in series (Equation 9-5: each basin on its own, loads chained). That is the only difference between the routings.
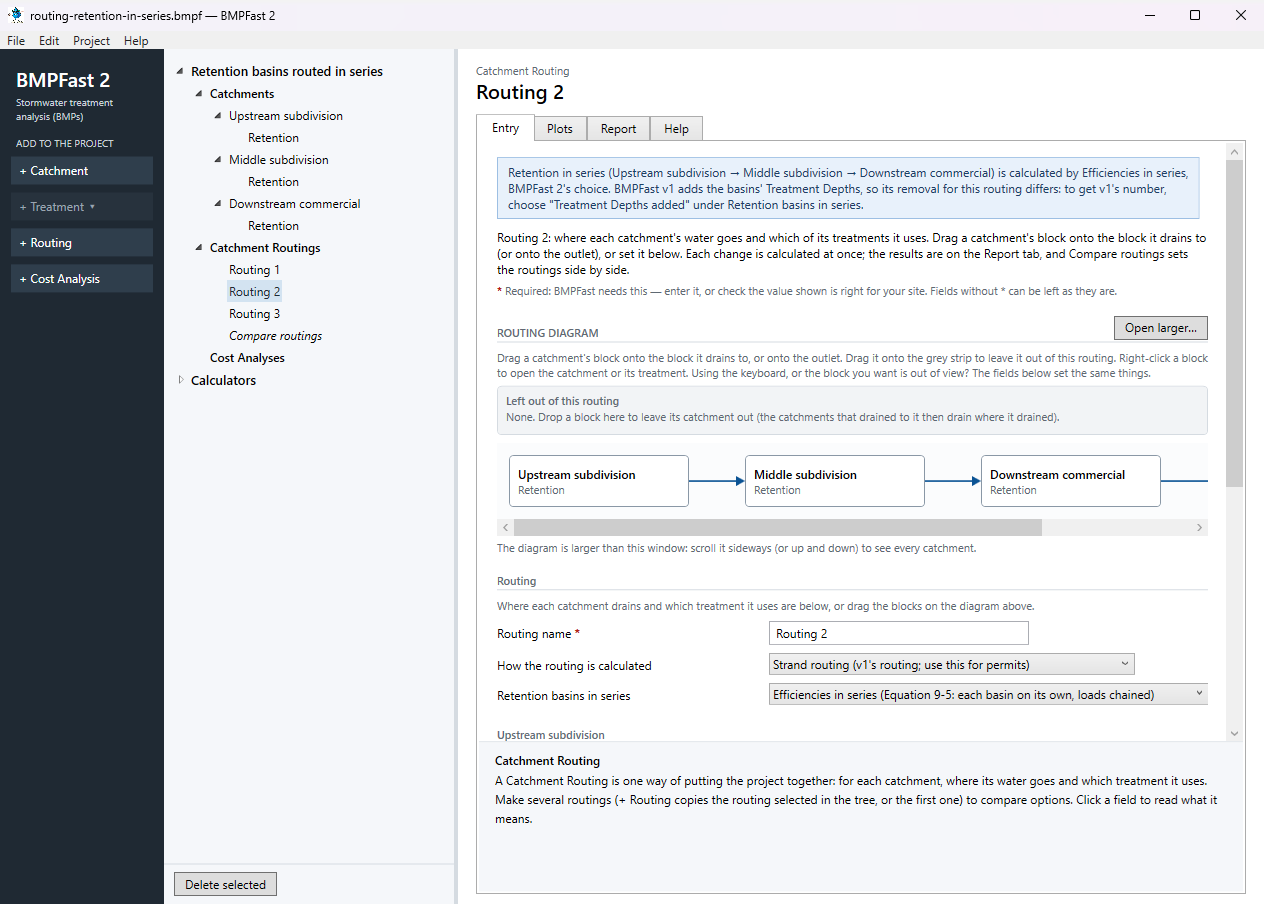
Routing 2 (Efficiencies in series): its Entry tab. Open Routing 2’s Report tab: Results for this method.
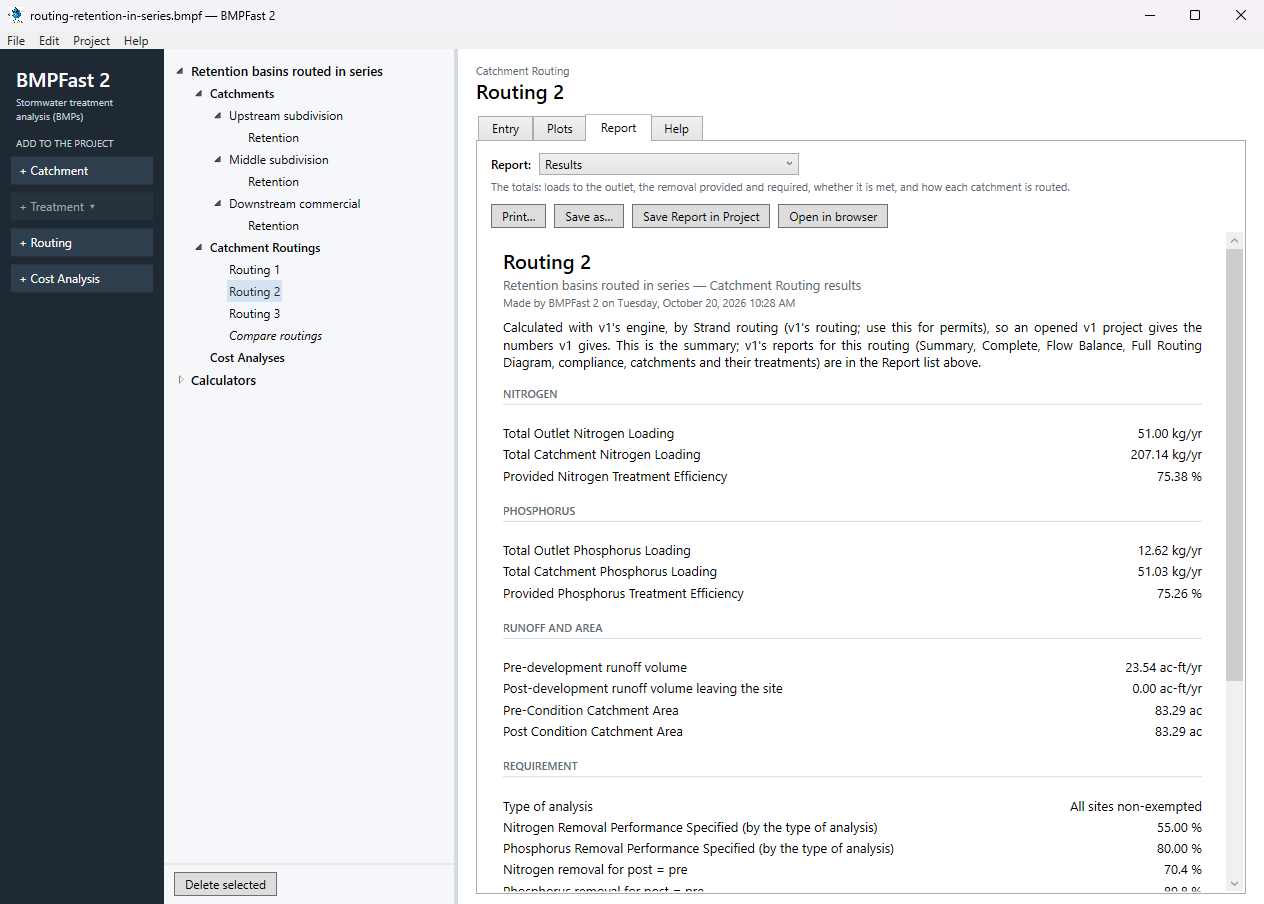
Routing 2 (Efficiencies in series): its Report tab, Results. Select Routing 1 in the tree and press Add Routing: BMPFast 2 adds Routing 3, a copy of Routing 1 (every catchment drains and is treated the same way). On its Entry tab choose Retention basins in series: Treatment Depths added (BMPFast v1's method; gives v1's numbers). That is the only difference between the routings.
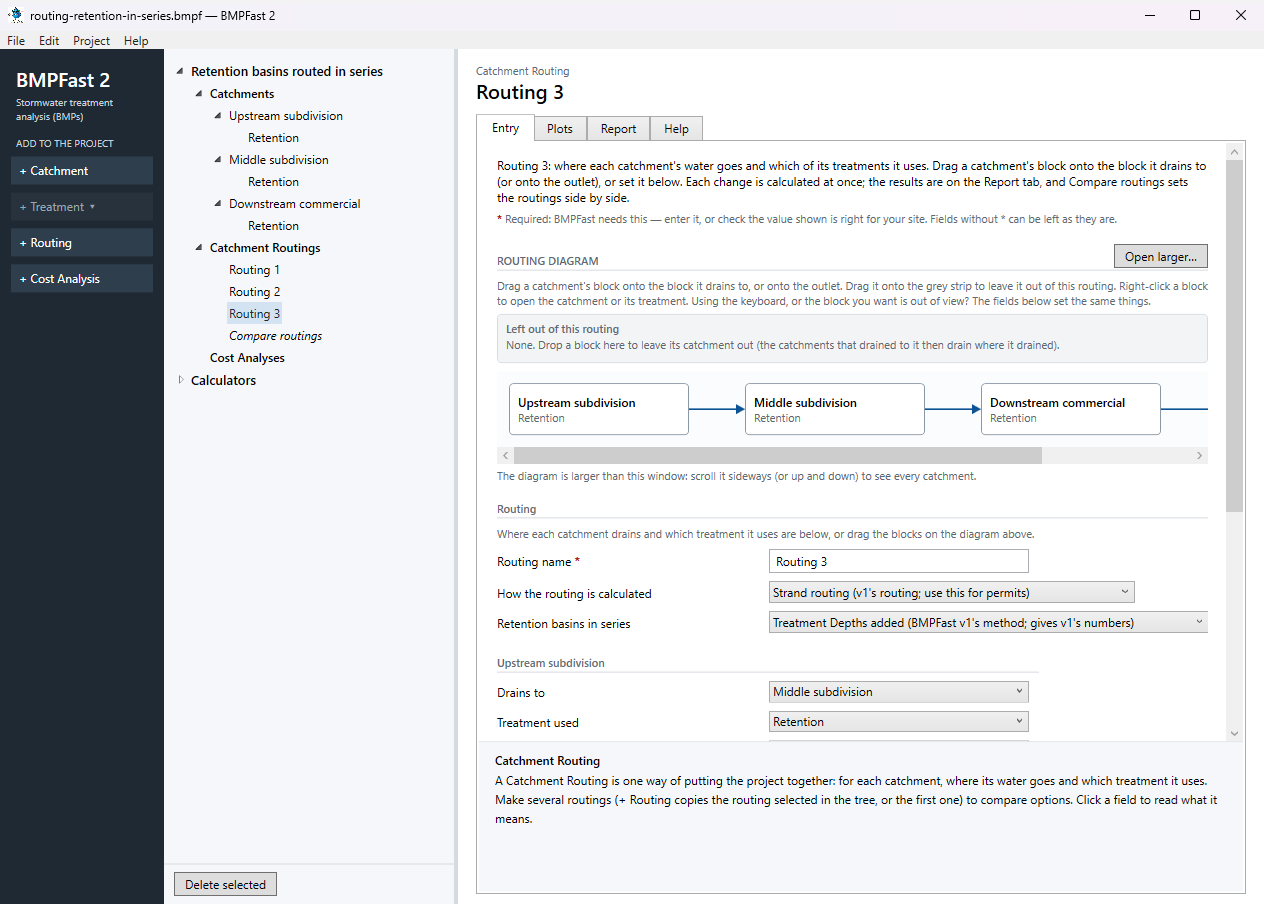
Routing 3 (Treatment Depths added): its Entry tab. Open Routing 3’s Report tab: Results for this method.
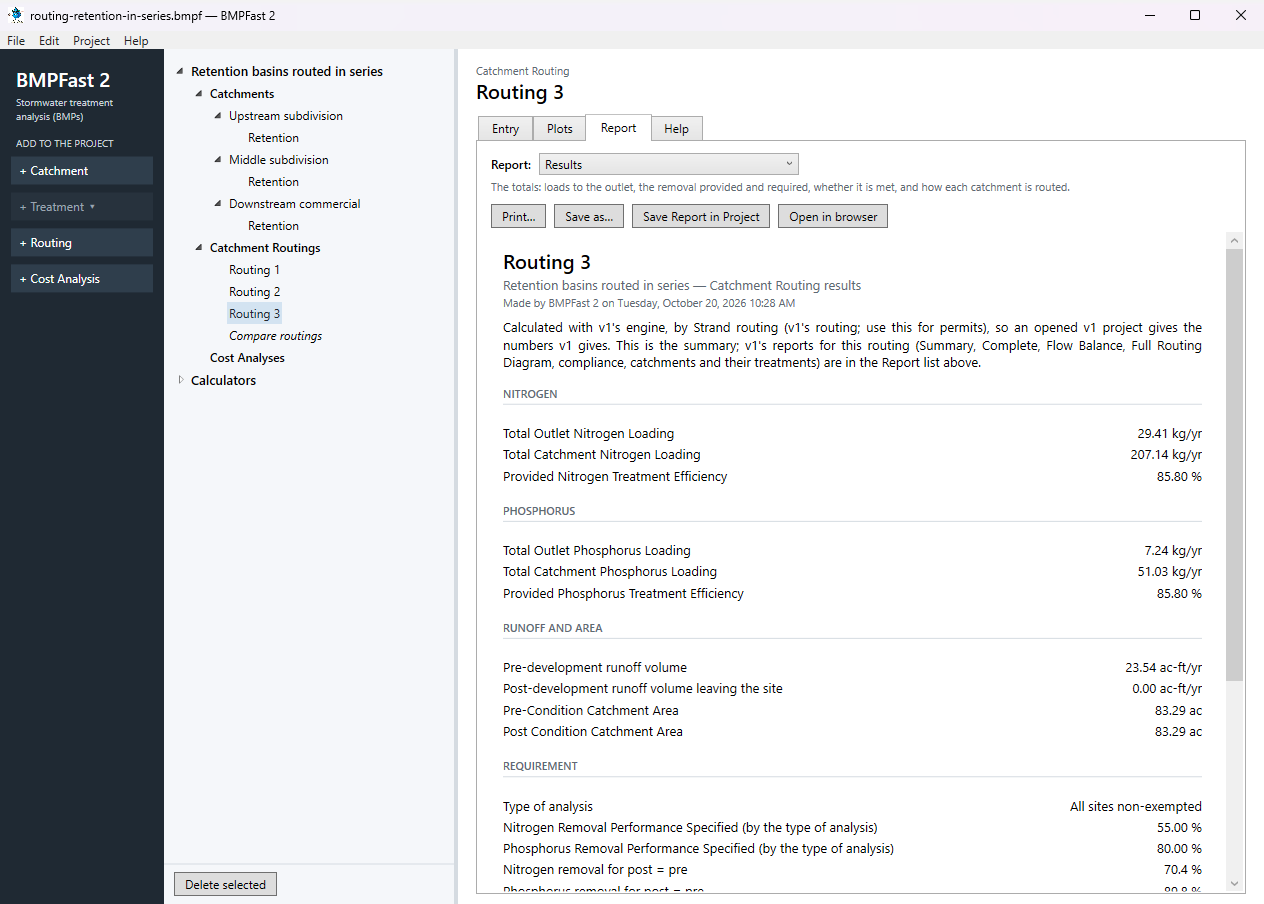
Routing 3 (Treatment Depths added): its Report tab, Results. With two routings or more, Compare routings appears at the end of Catchment Routings. Select it and open its Report tab: the routings side by side, the loads leaving the site and the removal by each method.
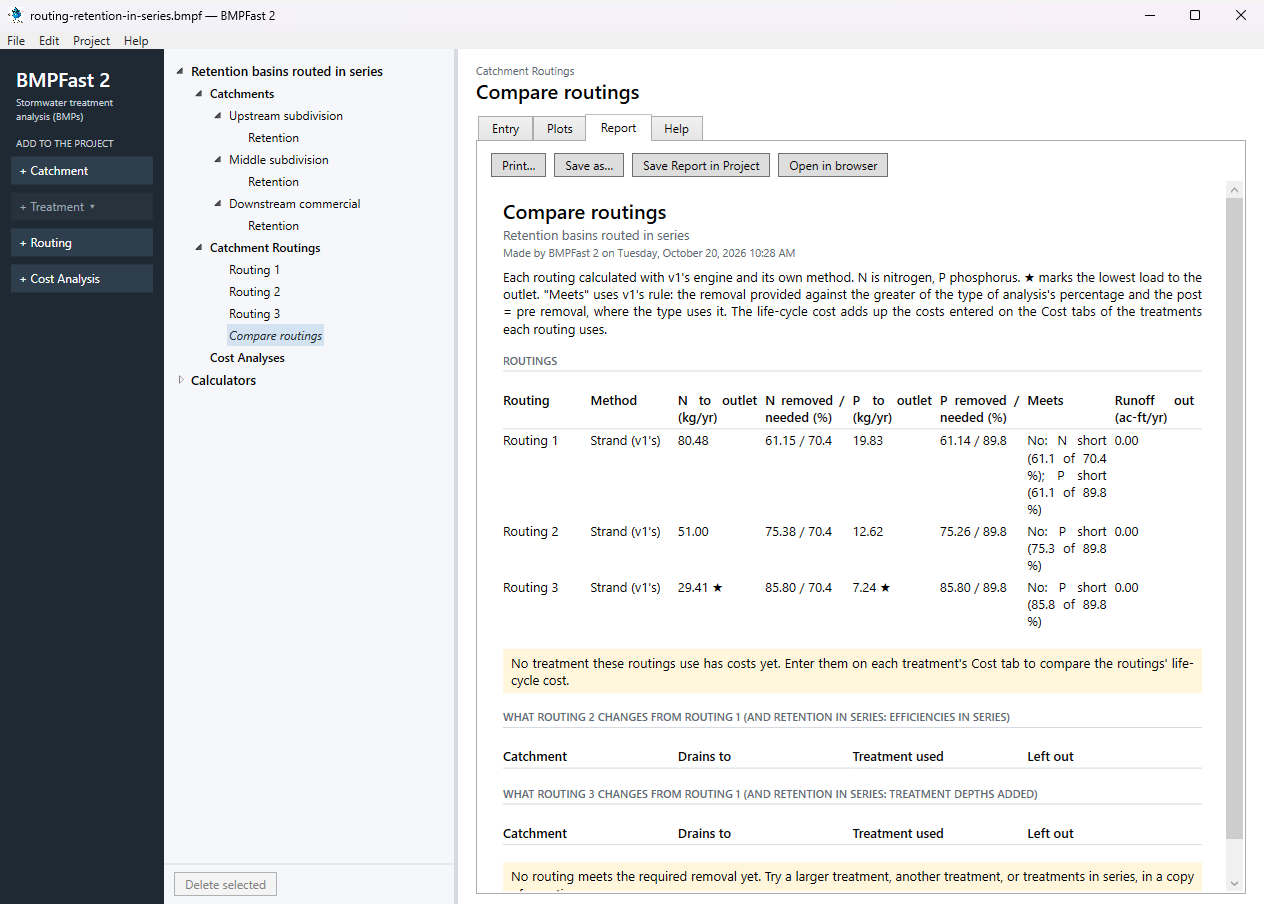
Compare routings: its Report tab, the routings side by side. Its Plots tab draws the same comparison as charts. Save the project with File ▸ Save; compare it with the .bmpf under Files.
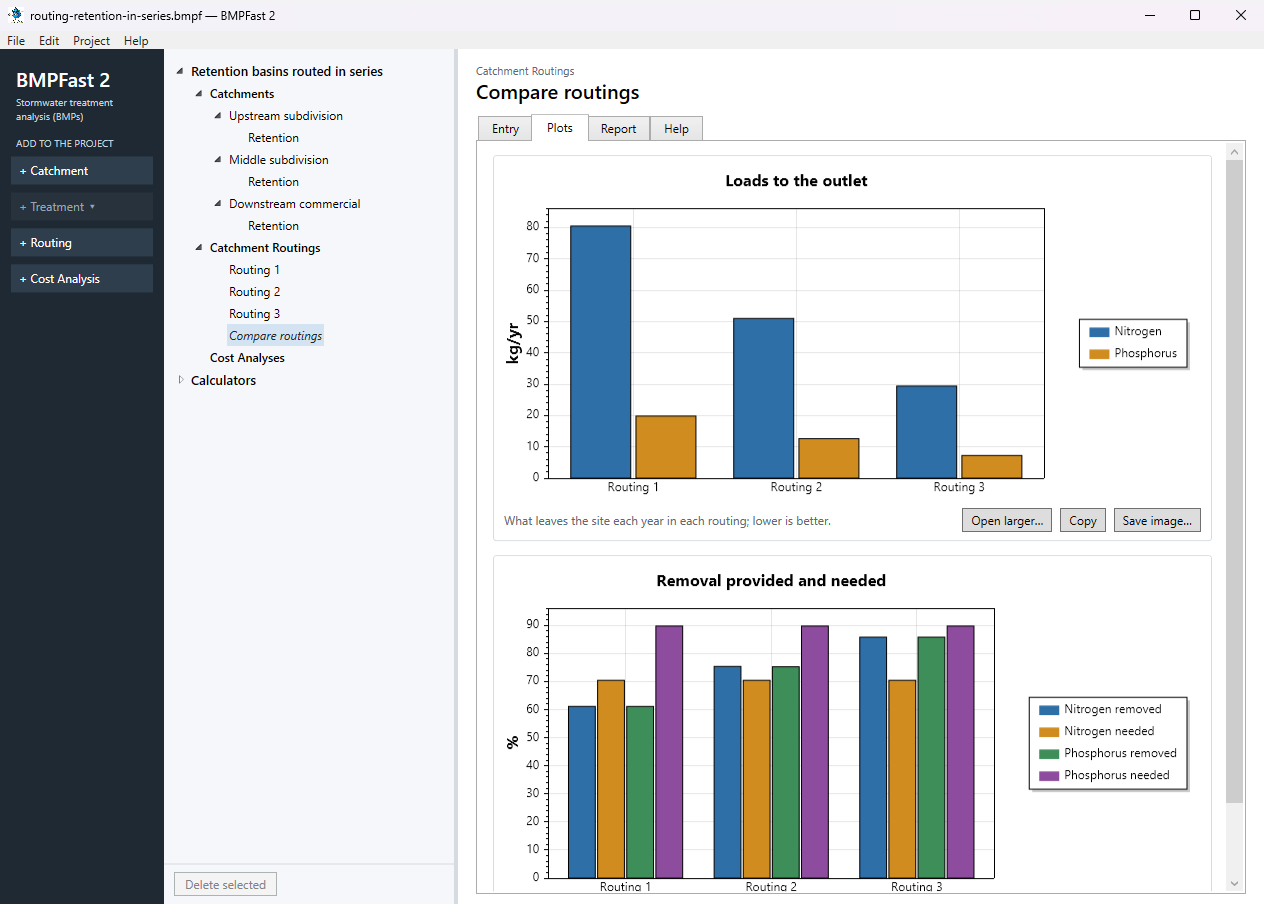
Compare routings: its Plots tab.
3Results
Which routing is which. Routing 1 is Treatment Depth Allocation, BMPFast 2’s default for routed retention basins (Ron Eaglin, October 19, 2026). Routing 3, Treatment Depths added, is BMPFast (v1)’s method and gives v1’s numbers. Routing 2 is the Handbook’s equation for BMPs in series (Equation 9-5). The three answers differ a great deal for the same basins, which is why the routing asks for the method and the reports name it; which one a submittal should use is open for the reviewers (question P4824-Q2 on the review page).
| Routing (method) | Leaving the site; removal | Performance standard met? |
|---|---|---|
| Routing 1: Treatment Depth Allocation | N 80.485 / P 19.831 kg/yr; removal N 61.15 % / P 61.14 % | No: N short (61.1 of 70.4 %); P short (61.1 of 89.8 %) |
| Routing 2: Efficiencies in series | N 50.996 / P 12.621 kg/yr; removal N 75.38 % / P 75.26 % | No: P short (75.3 of 89.8 %) |
| Routing 3: Treatment Depths added | N 29.409 / P 7.244 kg/yr; removal N 85.80 % / P 85.80 % | No: P short (85.8 of 89.8 %) |
| Catchment | Its treatment, alone |
|---|---|
| Upstream subdivision | 0.865 ac-ft = treatment depth 0.500 in: removal 65.38 % |
| Middle subdivision | 0.838 ac-ft = treatment depth 0.400 in: removal 59.13 % |
| Downstream commercial | 1.870 ac-ft = treatment depth 0.600 in: removal 62.37 % |
Compare routings (Report tab)
Open this report on its own page.
Routing 1: Results
Open this report on its own page.
BMPFast 2 and BMPFast (v1)
BMPFast (v1) has one method for retention basins routed in series: the Treatment Depths added. Its numbers are Routing 3's (the same code; BMPFast 2's parity tests check it against v1's own results).
4Check
Treatment Depth Allocation (Routing 1). At each catchment the treatment depth is the retention volume of the basins so far over the area of the catchments so far (volume × 12 / area). That catchment’s own nitrogen load is removed at the retention curves for that depth, with its own non-DCIA CN and DCIA; the removals are added.
| Catchment | Volume so far / area so far | Depth | Curves | N removed here (kg/yr) |
|---|---|---|---|---|
| Upstream subdivision | 0.865 ac-ft / 20.75 ac | 0.500 in | 65.38 % | 46.733 × 65.38 % = 30.553 |
| Middle subdivision | 1.703 ac-ft / 45.88 ac | 0.445 in | 61.95 % | 53.286 × 61.95 % = 33.011 |
| Downstream commercial | 3.573 ac-ft / 83.29 ac | 0.515 in | 58.90 % | 107.124 × 58.90 % = 63.095 |
Removed in all: 126.658 kg/yr of the 207.143 kg/yr; BMPFast 2: 126.658 kg/yr agrees.
Efficiencies in series (Routing 2). The Applicant’s Handbook Vol. I, Section 9.5.1, Equation 9-5: each basin removes, at its own treatment depth (the table above, “alone”), its share of everything that reaches it, and the loads are chained.
Treatment Depths added (Routing 3). The basins’ treatment depths are added (Equivalent Treatment Depth) and the capture at that depth, with the area-weighted CN and DCIA, is the removal of all the load. This is the method of BMPFast (v1); it counts each basin’s depth over the whole system, so it gives the highest removal here (85.80 % against 61.15 % and 75.38 %). See Strand Based Routing for Retention in Series, which works the methods by hand.
5Files
- routing-retention-in-series.bmpf: the project, saved by BMPFast 2. Save it (your browser puts it in Downloads), then in BMPFast 2 choose File ▸ Open and open it. Opened again and calculated, it gives the numbers on this page.
- Routing 1 (BMPFast 2’s report, as Open in browser on its Report tab gives it)
- Routing 1 — Summary Report (BMPFast 2’s report, as Open in browser on its Report tab gives it)
- Retention (Upstream subdivision) (BMPFast 2’s report, as Open in browser on its Report tab gives it)
- Retention — calculations (Upstream subdivision) (BMPFast 2’s report, as Open in browser on its Report tab gives it)
- Retention (Middle subdivision) (BMPFast 2’s report, as Open in browser on its Report tab gives it)
- Retention — calculations (Middle subdivision) (BMPFast 2’s report, as Open in browser on its Report tab gives it)
- Retention (Downstream commercial) (BMPFast 2’s report, as Open in browser on its Report tab gives it)
- Retention — calculations (Downstream commercial) (BMPFast 2’s report, as Open in browser on its Report tab gives it)
- Routing 1 (Upstream subdivision) (BMPFast 2’s report, as Open in browser on its Report tab gives it)
- Routing 2 (Middle subdivision) (BMPFast 2’s report, as Open in browser on its Report tab gives it)
- Routing 3 (Downstream commercial) (BMPFast 2’s report, as Open in browser on its Report tab gives it)
- Compare routings (BMPFast 2’s report, as Open in browser on its Report tab gives it)
6Help and methodology
Calculated with BMPFast 2 version 2.0.0 (2026-10-20), a problem of BMPFast 2’s own. Screen captures are of BMPFast 2’s own window and are for demonstration only.