
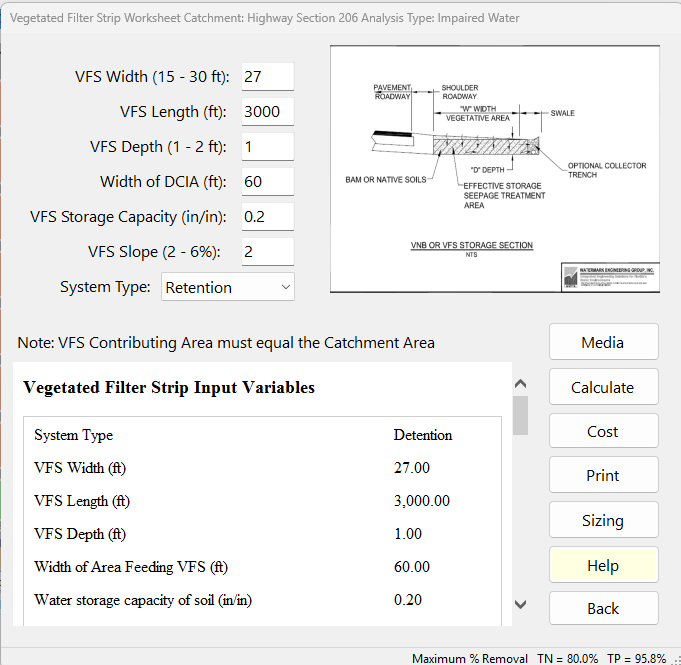
The Vegetated Filter Strip Worksheet is where you describe a vegetated filter strip (VFS) beside a road or parking area and see how much nitrogen and phosphorus it removes from that catchment’s runoff. Enter the strip’s dimensions and storage, choose whether it is treated as Retention or Detention, pick a media mix (needed for Detention), and press Calculate.
Description
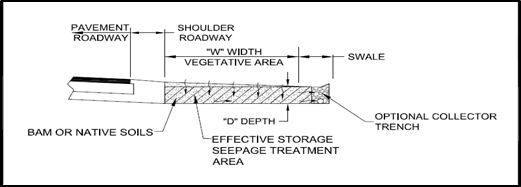
Vegetated Filter Strips are used adjacent to highways and parking areas. They have selected bio-sorption activated media (BAM) beneath the surface.
Runoff water enters the VFS as overland flow. Then the water appears after passing through the BAM and is discharged to a surface water transport nearby, usually a ditch or swale.
The seasonal high-water table is usually greater than one foot below the ground at the point of surface discharge. Typically, 12 inches of media is used. The minimum design width in the direction of flow to obtain capture and pollution control is 15 feet. Usually, for the first 15 feet, the water table intercepts the flow, or an impermeable membrane is used to redirect the flow horizontally.
There are various BAM media used in filter strips (Chang, N, Dan Wen, Andrea Valencia, William Colona, and Martin Wanielista. (2019). Comparison of Biological Nutrient Removal via Two Biosorption Activated Media between Laboratory-scale and Field-scale Linear Ditch for Stormwater and Groundwater Co-Treatment. Water, Air and Soil Pollution Journal). In BMPFast the media mix you choose is used for both System Types: with Detention it adds to the surface discharge removal, and with Retention it is used in the groundwater analysis (see below).
A vegetated cover must be used as well as a minimum of 3 inches of topsoil with vegetation. The topsoil must infiltrate at a rate greater than the infiltration rate of the BAM. Typical values are 5-20 inches/hour. The storage volume of the BAM is dependent on the type of BAM used. If native soils are used, they must be homogeneously mixed and certified. Details on removal using BAM mixes in Florida have been documented (Shokri, M, et.al. (2021). Hydraulic and Nutrient Removal Performance of Vegetated Filter Strips with Engineering Infiltration Media for Treatment of Roadway Runoff. Journal of Environmental Management. Volume 300. Dec 15, 113747).
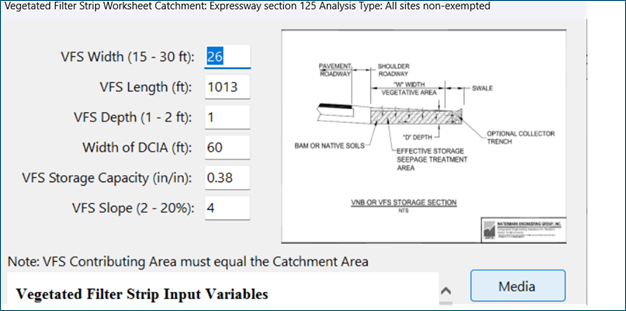
A schematic of the VFS is shown as:
System Type: Retention or Detention
The System Type drop-down decides how BMPFast calculates the strip. Projects saved before this choice existed calculate as Retention.
- Retention — the strip stores and infiltrates runoff. The VFS width, depth and storage capacity and the width of the DCIA give a Treatment Depth. The hydraulic capture is read from the retention efficiency curves for that depth, and the nitrogen and phosphorus removal are equal to the hydraulic capture. The slope, the buffer tables and the media mix do not change the removal; the media mix is used in the groundwater analysis.
- Detention — no volume is retained, so the hydraulic capture is 0. The nitrogen and phosphorus removal are read from the vegetated buffer tables (the same tables as the Vegetated Buffer with Detention + Plants) for the VFS width and slope, and the media mix then treats what the vegetation leaves (a treatment train). A Detention filter strip is built with a media; with none chosen the removal is the buffer tables’ alone and the report warns. The Treatment Depth does not change the removal. The report says “Treated as Detention”, explains why the capture is 0, and shows the media step with its numbers.
Applicant’s Handbook reference
Appendix O, Table 1 (BMP Efficiencies), Green Stormwater Infrastructure Efforts: Vegetated filter strips are listed with “Use appropriate retention or detention calculation for volume captured then add an additional removal based on plant, soil and media selections in a treatment train configuration”; BMPFast’s Detention type follows this (no volume captured, plant removal from the buffer tables, then the media), while its Retention type credits the volume captured only.
Inputs
The labels below are as they appear on the worksheet; the names in brackets are those used in the report, on the Equations page and in Sizing. Where a range is given, the worksheet holds the value inside it: a value typed outside the range is replaced by the nearest limit when the worksheet reads the boxes (Calculate, Media, Sizing or Back), and the box then shows the value used.
| Input | Units | What it means / how it is used |
|---|---|---|
| VFS Width (15 – 30 ft) | ft | Width of the strip in the direction of flow. Held between 15 and 30 ft (15 ft is the design minimum): a width outside the range is changed to the nearest limit on Calculate or Back, with a message (also on Plot and Sizing), and the report notes the change. A project saved with a width outside the range gets a warning in its report until the worksheet is calculated. Retention: enters the Treatment Depth. Detention: the width used to read the buffer tables. Also used for the Contributing Area. [VFS Width] |
| VFS Length (ft) | ft | Length of the strip along the road. Used only for the Contributing Area; it does not change the removal. [VFS Length] |
| VFS Depth (1 – 2 ft) | ft | Depth of the media/soil that stores water. Held between 1 and 2 ft. Retention only: enters the Treatment Depth. [VFS Depth] |
| Width of DCIA (ft) | ft | Width, in the direction of flow, of the directly connected impervious area (for example the pavement and shoulder) that drains onto the strip. Retention: the runoff from the DCIA and the strip is spread over the strip, so a wider DCIA lowers the Treatment Depth. Also used for the Contributing Area. [Width of Area Feeding VFS] |
| VFS Storage Capacity (in/in) | in/in | Water the strip’s media/soil can store per inch of depth: its sustainable void fraction (for example 0.38 in/in for a media with 38 % sustainable void). Retention only: enters the Treatment Depth. [Water storage capacity of soil] |
| VFS Slope (2 – 6%) | % | Slope of the strip in the direction of flow, no more than 6 %: BMPFast limits the slope to 6 %: the buffer tables have data for 2 % and 6 % slopes only, and there is no data for steeper slopes. The worksheet refuses a steeper slope when you Calculate, Plot, size or go Back, and says so; a slope under 2 % is analysed at 2 %. Detention only: the slope used to read the buffer tables. Not used for Retention. [Slope of VFS] |
| System Type | — | Retention or Detention (see above). A fixed list; hover over it for a summary of each. |
Important: the contributing area must equal the runoff area plus the VFS area, and that sum must equal the catchment’s area (1. Enter Catchment). BMPFast calculates the three areas from your inputs and lists them in the report’s input table with the Watershed Area. When the Contributing Area differs from the Watershed Area by more than 1 %, the report warns and gives the Width of Area Feeding VFS that makes them equal:
Runoff Area (ac) = Width of Area Feeding VFS x VFS Length / 43,560
VFS Area (ac) = VFS Width x VFS Length / 43,560
Contributing Area (ac) = Runoff Area + VFS Area = (VFS Width + Width of Area Feeding VFS) x VFS Length / 43,560
Example: 3000 ft × (18.56 + 25 ft) = 130,680 sf = 3.0 acres.
The watershed values (non-DCIA curve number, DCIA percent, rainfall zone and rainfall) come from the catchment and the General Site Information; they are not entered here.
Media
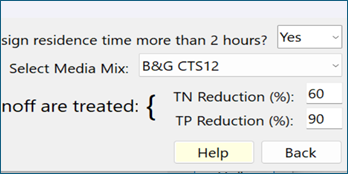
The Media button opens the media mix form. Choose the mix (for example B&G CTS12, the mix typically used in filter strips), answer “Is the media design residence time more than 2 hours?” and the form shows the mix’s TN and TP Reduction (%). Answering No gives some mixes (B&G ECT Mixes, SAT) a lower removal of 25 %. Choosing User Defined opens the media mix library, where you can pick or create your own mix.
For a filter strip the media mix is used with both System Types. Detention (surface discharge): the media’s TN and TP Reduction treats the runoff the buffer tables leave, so N removal = buffer N + media N x (100 – buffer N) / 100 (P the same), as the Rain Garden treats its media in Detention. A Detention strip needs a media; without one the report warns. Retention (groundwater analysis): the water the strip retains (the hydraulic capture) carries its N and P load into the media, and the media’s TN and TP Reduction is applied before it reaches the groundwater; the surface discharge removal is the same with or without a media mix. The reductions are the media library’s TN and TP values for the mix (Media and Filtration Methodology). With a mix chosen, the report title reads “Vegetated Filter Strip with media” and the report adds a Media Mix Information table.
Applicant’s Handbook reference
Section 9.5.1 Treatment Train Nutrient Reduction (Equation 9-5): BMPs in series are combined as 1 − [(1 − Eff1) × (1 − Eff2)]; BMPFast adds the media’s removal to the buffer tables’ removal this way.
Equations
Methodology. With System Type Retention, BMPFast treats this BMP as retention. Retention BMPs compares how every retention BMP calculates its Treatment Depth, and Retention Methodology explains the retention curves it is read on.
With System Type Detention, see Media and Filtration Methodology.
Retention
Treatment Depth (in) = 12 in/ft x VFS Width x VFS Depth x Soil Storage Capacity / (VFS Width + Width of Area Feeding VFS)
Hydraulic Capture (%) = retention curves (Treatment Depth, non-DCIA CN, DCIA %, rainfall zone)
N removal (%) = P removal (%) = Hydraulic Capture
Detention
Buffer N (%) = Nitrogen buffer table (Slope of VFS, VFS Width)
Buffer P (%) = Phosphorus buffer table (Slope of VFS, VFS Width)
N removal (%) = Buffer N + Media N Reduction x (100 - Buffer N) / 100
P removal (%) = Buffer P + Media P Reduction x (100 - Buffer P) / 100
Hydraulic Capture (%) = 0 (no volume is retained)
The buffer tables give the removal (%) at a 2 % and a 6 % slope for widths of 10 to 350 ft, interpolated linearly in slope and width; the filter strip uses the part from 15 to 30 ft. The slope is limited to 6 % (there is no data for steeper slopes); a slope under 2 % is analysed at 2 %.
The same tables are used for the Vegetated Natural Buffer, and they apply to a constructed filter strip as well. They are based on EPA/600/R-05/118 (Mayer et al. 2005) and were approved for use in BMPTrains, with FDOT and water management district staff involved in their development and use; a Florida field study of filter strips with engineered media (Shokri et al., Journal of Environmental Management, 2021) found TN removal of 80 ± 5 % within a 6 m (20 ft) strip. The sources are described on the Vegetated Natural Buffer page.
Source reference
Mayer, P.M., Reynolds, S.K. Jr., Canfield, T.J. and McCutchen, M.D. (2005). Riparian Buffer Width, Vegetative Cover, and Nitrogen Removal Effectiveness. EPA/600/R-05/118, Table 2 (link): the TN rows of the buffer tables (see the Vegetated Buffer page); the TP rows are the BMPTrains model’s.
Shokri, M., Kibler, K.M. et al. (2021). Hydraulic and nutrient removal performance of vegetated filter strips with engineered infiltration media for treatment of roadway runoff. Journal of Environmental Management 300, 113747 (link): a Florida field study of filter strips with engineered media; it supports the tables but its values are not used in the calculation.
BMPFast method (frmVegetatedFilterStrip; Ron, 2026-10-09): the 15 to 30 ft width and 1 to 2 ft depth limits are BMPFast’s design limits for a filter strip.
| Width (ft) | TN at 2 % (%) | TP at 2 % (%) | TN at 6 % (%) | TP at 6 % (%) |
|---|---|---|---|---|
| 10 | 50 | 25 | 10 | 5 |
| 25 | 60 | 40 | 15 | 10 |
| 50 | 65 | 55 | 25 | 15 |
| 100 | 75 | 60 | 45 | 25 |
| 350 | 90 | 65 | 60 | 65 |
Example (Retention), with the input data shown below: VFS Width 26 ft, VFS Depth 1 ft, VFS Storage Capacity 0.38 in/in and Width of DCIA 60 ft give a Treatment Depth of 12 x 26 x 1 x 0.38 / (26 + 60) = 1.38 in. The hydraulic capture for 1.38 in is read from the retention curves for the catchment’s curve number, DCIA percent and rainfall zone, and the N and P removal equal that capture.
Applicant’s Handbook reference
Appendix O, Green Stormwater Infrastructure: GSI “can also treat stormwater similar to a traditional BMP by treating TN and TP as a retention system”; with Retention selected BMPFast turns the strip’s storage into a treatment depth and reads the Appendix O, Dry Retention Systems tables for it.
Results
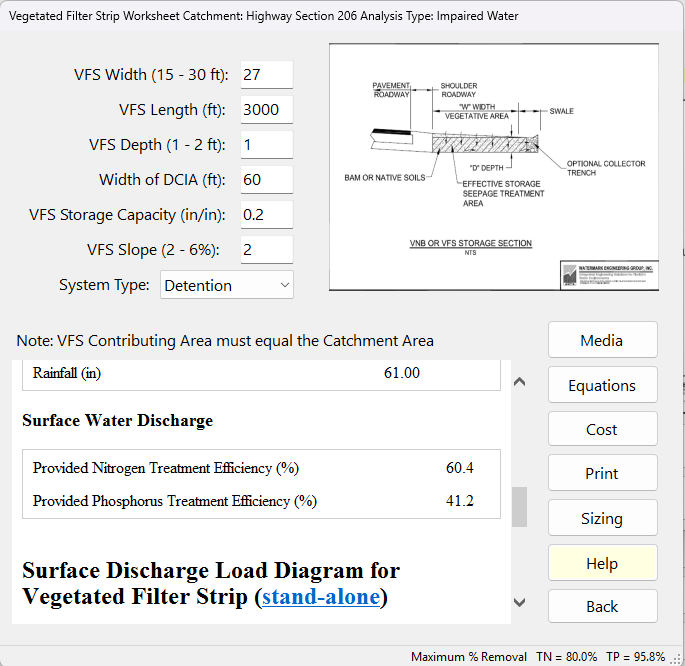
- Vegetated Filter Strip Input Variables — the values used; Runoff Area, VFS Area, Contributing Area and Watershed Area (acres); for Detention a note explaining that the removal is from the buffer tables and the capture is 0; and a warning when the Contributing Area and the Watershed Area differ by more than 1 %.
- Watershed Characteristics — Watershed Area (acres), Contributing Area to BMP (ac), Watershed Non-DCIA Curve Number, Watershed DCIA Percent, Rainfall Zone and Rainfall (in). Compare the Contributing Area with the Watershed Area.
- Surface Water Discharge — Provided Nitrogen and Provided Phosphorus Treatment Efficiency (%). A value of 100 % or more is shown as 99 %.
- Media Mix Information and Groundwater Discharge (Stand-Alone) — shown when a media mix is chosen or Conduct Groundwater Discharge Analysis is Yes: the mix and its N and P Reduction (%), then Average Annual Recharge (MG/yr, the volume infiltrated), TN and TP Mass Load (kg/yr) and TN and TP Concentration (mg/L) reaching the groundwater. With Detention nothing is retained, so the groundwater loads are 0.
- Surface Discharge Load Diagram — Load in (N and P in kg/yr, Q in ac-ft/yr), Treatment (N and P removal, %), Surface Discharge (N, P and Q leaving the strip) and Mass Reduction (kg/yr), for this catchment’s runoff alone.
The strip at the bottom of the worksheet shows the project’s Maximum % Removal for TN and TP.
Buttons
| Button | What it does |
|---|---|
| Media | Opens the media mix form (see Media above), then recalculates. With Detention the mix adds to the removal; with Retention it is used in the groundwater analysis. |
| Calculate / Equations / Report | One button with three jobs. After you change an input it reads Calculate: it calculates with the values entered and shows the report. Once the report is current it reads Equations and shows the Equations page; it then reads Report and takes you back. |
| Cost | Opens the Life-Cycle Cost Analysis for this filter strip (construction, replacement and maintenance costs, present worth and cost per pound of N and P removed). |
| Opens what is showing (report or Equations page) in the Report Viewer, where it can be printed or saved. | |
| Help | Opens this page. |
| Sizing | Opens the Sizing form: change VFS Width, VFS Length, VFS Depth, Width of Area Feeding VFS, storage capacity and Slope of VFS with arrows and see the N and P removal against the targets on a chart. Apply keeps the values; Cancel discards them. Works for Retention and Detention. See Sizing. |
| Back | Reads the boxes, calculates, saves to the project and returns to the previous screen. With Detention and no media mix it first offers to open Media; answer No to go back without one. |
The Equations page
The Equations page shows the equations for the System Type in use, notes on how they are applied, and a Values table: VFS Width, VFS Length, VFS Depth, Width of Area Feeding VFS, Water storage capacity of soil, Slope of VFS, then Contributing Area, Watershed Area, Non-DCIA Curve Number, DCIA Percent, Rainfall Zone, Treatment Depth, Hydraulic Capture (%), Treatment Rate (gpm/sf of the media mix, or “(no media mix)”) and N and P removal (%). For Detention the removal rows read “* with vegetation only” and the page adds the Nitrogen and Phosphorus buffer tables, each with the value read at the current width and slope.
Notes and limits
- A filter strip normally treats only the runoff from its own catchment: flows routed from upstream catchments bypass it and go on, untreated, to the next catchment, and the routing report notes it. Should one of them be designed to treat the upstream runoff too, untick Bypass upstream runoff on this catchment’s Routing screen (BMPFast asks once when a catchment is first routed into it).
- Sizing uses the worksheet’s limits: VFS Width 15 to 30 ft, VFS Depth 1 to 2 ft and Slope of VFS 2 to 6 %, so a sized value is kept as it is when you calculate.
- In a Multiple BMP series, a filter strip set to Retention counts as a retention BMP; one set to Detention does not.
Frequently Asked Questions
Q: Is a media required for pollutant removal? And what one is typically used?
A: With Detention, yes: the media’s reduction is added to the buffer tables’ removal, and the report warns when no media is chosen. With Retention the removal comes from the Treatment Depth, and the media mix is used for the groundwater analysis. Typically, the B&G CTS12 media is used.
Q: What is the residence time in the media?
A: The residence time is the minimum contact time, and for all the specified media it is greater than 2 hours, because the filter media rate of treatment is about 5 inches per hour. Answer “Yes” to the residence-time question on the media form unless your design gives less than 2 hours.
Q: What is the typical depth of media?
A: The typical depth is 1 foot. The worksheet accepts a VFS Depth of 1 to 2 ft.
Q: Can I use a VFS width less than 15 feet?
A: No, the minimum design width is 15 feet. Research showed that the minimum width is required to achieve the removal.
Q: What if my width is greater than 30 feet? What do I do?
A: Any width greater than 30 feet produces no additional removal. The worksheet uses 30 ft for any larger width.
Q: Does the catchment area equal the watershed area?
A: Yes. The contributing area (the runoff area plus the VFS area) must equal the catchment’s area. After Calculate, the report lists both and warns, with the feeder width that would match, when they differ by more than 1 %.
Q: My slope is 1%. What should I do?
A: Nothing: below the lower limit the boundary value is used, so a 1 % slope is analysed at 2 %. The slope matters only for Detention.
Q: My slope is equal to 30%, so can I evaluate this VFS?
A: No. The slope is limited to 6 %: BMPFast limits the slope to 6 %: the buffer tables have data for 2 % and 6 % slopes only, and there is no data for steeper slopes. The worksheet says so and asks for a slope of 6 % or less.
Sample problems
Worked problems solved in BMPFast, each with every input, the steps with screen captures, the program’s results, a hand check and the project file to download. Captures are for demonstration only. All of them: BMPFast sample problems.