Traffic volumes
3 Traffic sets how much traffic uses the network at today's demand, and where it comes in and goes out. The cars on the page pick their own routes between the road ends. Traffic is in vehicles per hour (veh/h) in the busiest hour.
What you need to do here: nothing, if the starting traffic is good enough to begin with. To match the real intersection, set how many vehicles come in at each road end — from FDOT's counts or typed from a count.
How traffic is given
Choose one of two ways under How traffic is given:
- One total, shared by how busy each road end is — type the Vehicles entering the whole study, and for each road end a number for how busy it is compared with the others (900 sends and receives about twice the trips of 450). Each road end then shows how many vehicles an hour come in there.
- Vehicles per hour typed for each road end — type the vehicles an hour coming in at each road end (from a class count sheet, for example), and how busy each is as a destination.
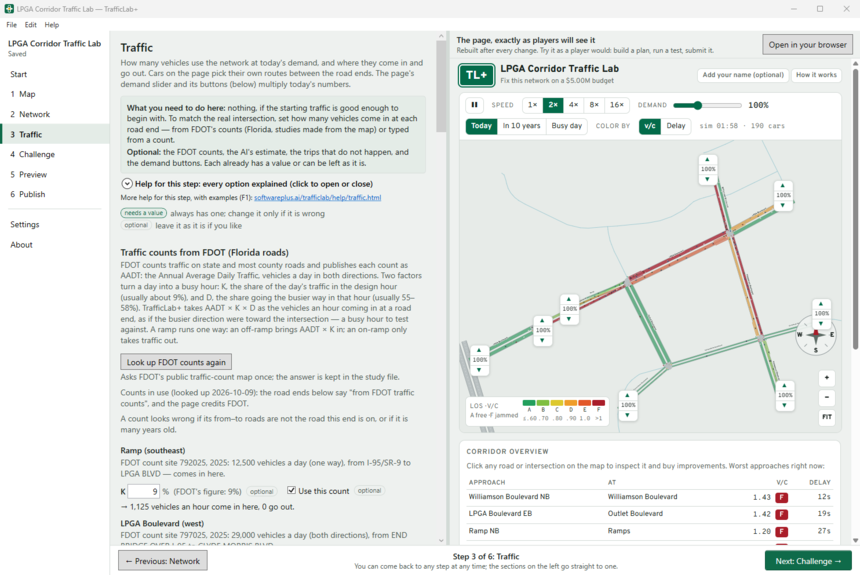
Traffic counts from FDOT (Florida roads)
FDOT, the Florida Department of Transportation, counts traffic on state and most county roads and publishes each count as AADT, the Annual Average Daily Traffic: vehicles a day in both directions, averaged over a year. TrafficLab+ turns a day into a busy hour with two factors:
- K — the share of a day's traffic in the design hour (FDOT's busy hour), usually about 9%.
- D — the share going the busier way in that hour, usually 55 to 58%.
Vehicles an hour coming in at a road end = AADT × K × D. For example, 29,000 a day × 9% × 55% ≈ 1,436 vehicles an hour. A ramp runs one way: an off-ramp brings AADT × K in; an on-ramp only takes traffic out.
- Press Look up FDOT counts for these roads. TrafficLab+ asks FDOT's public count map once and matches each count to its road end. (Once a study has counts, the button reads Look up FDOT counts again.)
- Check each one: the count site, year, AADT and FDOT's description of the stretch counted. Each K and D starts at FDOT's own figure for that count; change one if your instructor gives you another.
- Untick any count that looks wrong — its from–to roads are not this road, or it is many years old. A road with no count (local and private roads are rarely counted) keeps its estimate.
- Press Use the ticked counts. The road ends now say from FDOT traffic counts, the page is rebuilt busier, and its credit line names FDOT. Ctrl+Z puts the old numbers back; Stop using the counts goes back to one shared total.
Counts are found by where the roads are on the map, so they need a study made from the Map, in Florida. The counts are kept in the study file, so they are not looked up again. Outside Florida, many cities and states publish their own counts: choose Vehicles per hour typed for each road end and type them, or ask the AI.
Estimate traffic with the AI (optional)
Estimate traffic with the AI… estimates the busy-hour vehicles an hour at each road end that has no count, from the kind of road, the place and anything you tell it (for example, "Weekday evening rush. The outlet mall is busy; Cornerstone is a quiet back road."). Road ends with FDOT counts in use are kept. You see each estimate with its reason and apply the ones you want; applying switches How traffic is given to typed volumes. See The AI.
Trips that do not happen
Pairs of road ends with no trips between them. At LPGA, traffic from the I-95 north ramps does not get off and back on to go south, so that pair is listed. Leave this empty unless you know of one. The sentence under Why (shown on the page) appears on the page. To add a pair, choose its two road ends and press Add this pair; a pair that is already there is refused with That pair is already listed. Remove beside a pair allows trips between them again.
Demand buttons on the page
Each is a button on the page's toolbar that sets demand to a percentage of today's: Today at 100%, a future year or a busy event day above it (LPGA has 2035 and Race Week). Players use them to test their plans in harder conditions. Up to five; the name is what the button says, and 125 means a quarter more than today.