
Each section below is the help that screen shows in Assessment+ itself, on its ℹ Help & Information tab (or F1), so it matches what you see on screen.
Program Reports
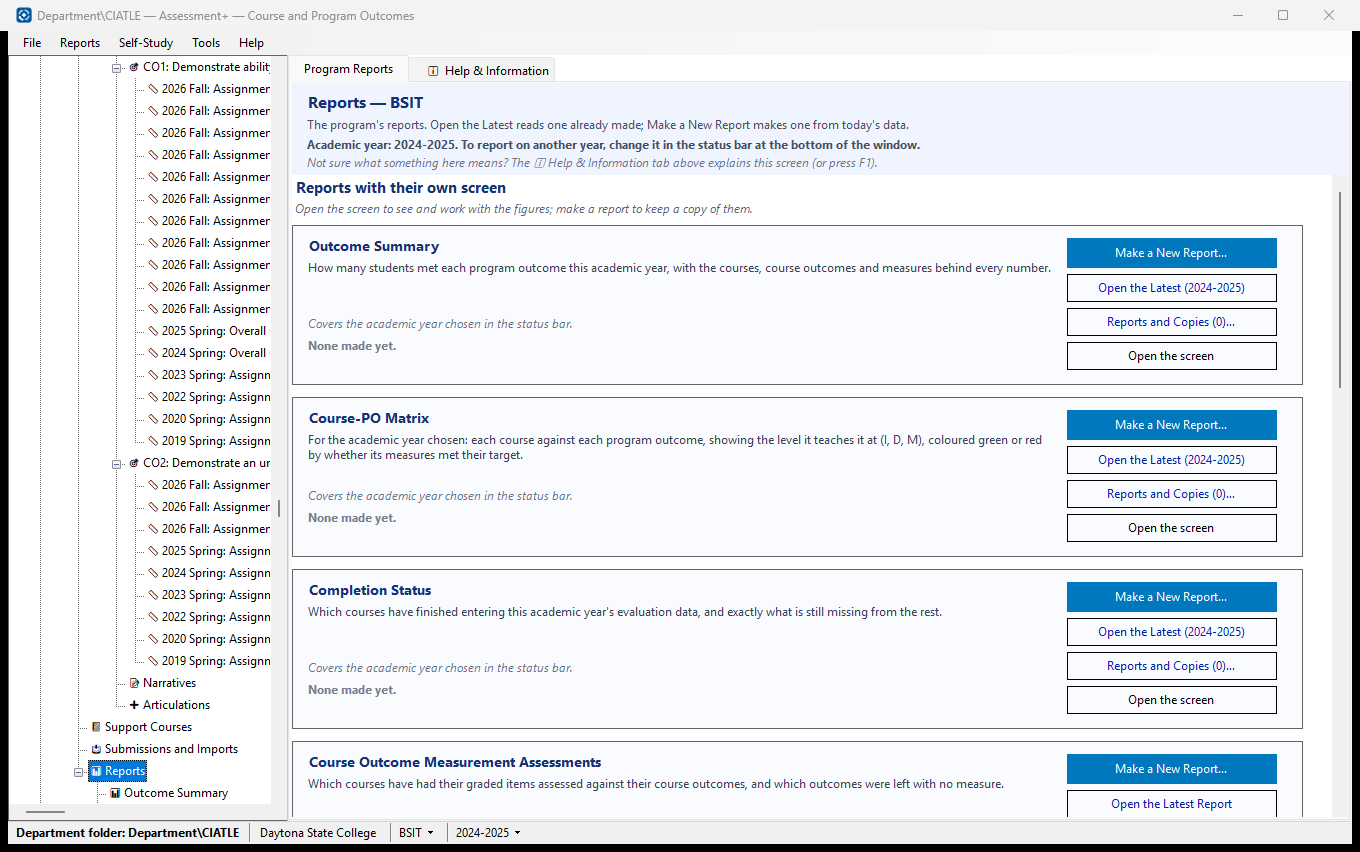
Every program report in one place: how students did on each program outcome, which courses map to which outcomes, whose evaluation data is still missing, which courses have had their graded items checked against their outcomes, the institution's Learning Outcomes Assessment spreadsheet and annual report, trends across the years, course histories and success rates. The Reports menu in the menu bar makes the same reports, under the same names.
How to use it
- Check the academic year shown at the top. A card that says "Covers the academic year chosen in the status bar" uses the one chosen in the drop-down in the status bar at the bottom of the window. Change it there first if it is not the year you want.
- The eleven cards are in two groups. Under "Reports with their own screen" (the first five), click "Open the screen" to work with the figures: expand courses, drill into an outcome, attach a missing file. Under "Printable reports" (the other six) there is no screen, so those cards have no such button: make the report and read it in the report viewer.
- Each card says when its report was last made — for a yearly report, for the year chosen in the status bar. Open the Latest reads that one again, and Reports and Copies lists every one made, with the PDF and Word copies saved from each — open one of those rather than making it again, unless the data has changed since.
- Make a New Report… makes it again from today's data. It opens in the report viewer, which saves it as PDF, Word or a web page, and it is kept and listed here.
- The FCE Summary Spreadsheet is the exception: "Make a New Spreadsheet…" writes the institution's Learning Outcomes Assessment sheet as an Excel workbook, and every one saved is listed.
What it means, and what to watch for
- The reports are in two groups. Reports with their own screen can be opened to see and work with the figures, and a report of them can be made and kept. Printable reports are documents only — read, printed or sent — made from the program's data and kept here.
- Outcome Summary: For each program outcome: how many students were measured, how many met the threshold, and whether the outcome was met. The report lists every course, course outcome and measure behind each number.
- Course-PO Matrix: Courses down the side, program outcomes across the top. A cell shows the level at which the course addresses the outcome (I, D, M) and is coloured by whether its measures met their target.
- Completion Status: Which program courses have finished entering this year's evaluation data, and what exactly is missing from the others.
- Course Outcome Measurement Assessments: Which courses have had their graded items judged against their course outcomes, and which outcomes no graded item measures. This one is not tied to an academic year.
- Annual Learning Outcomes Assessment Report: the institution's yearly report, in the shape of its document. Multi-Year Outcome Trend Report: each program outcome year by year. Course Assessment History and Course Success Rates cover every academic year that has results. A yearly report for a year with no counted results is not made: you are told what is missing and offered the Completion Status screen instead.
- Three reports lay courses against program outcomes, and each answers a different question. Course-PO Matrix: for one year, the level each course teaches each outcome at, coloured by whether its measures met their target. Measure Coverage by Program Outcome: for one year, which courses gave counted measures to each outcome, and whether each outcome has the recommended three. Curriculum Map: the program's design (levels only, no results, no year).
- A report is kept each time it is made, and listed on its card: it shows the data as it was that day. Make a new one after the data changes; otherwise open the one already made, or a PDF or Word copy of it.
- A saved PDF or Word copy is named program-report-year-date, e.g. BSET-OutcomeSummary-AY2025-2026-2026-09-22.pdf, so a folder of them sorts by program.
- Nothing here uses an AI provider, and nothing leaves this computer.
See also
- The Reports menu in the menu bar: the same reports for the program and year chosen in the status bar. A report made there is kept and listed here, and one made before is offered first.
- Submissions and Imports (under the program): where faculty submissions come in.
- 📊 Reports under each course in Courses: one course's own reports.
Outcome Summary
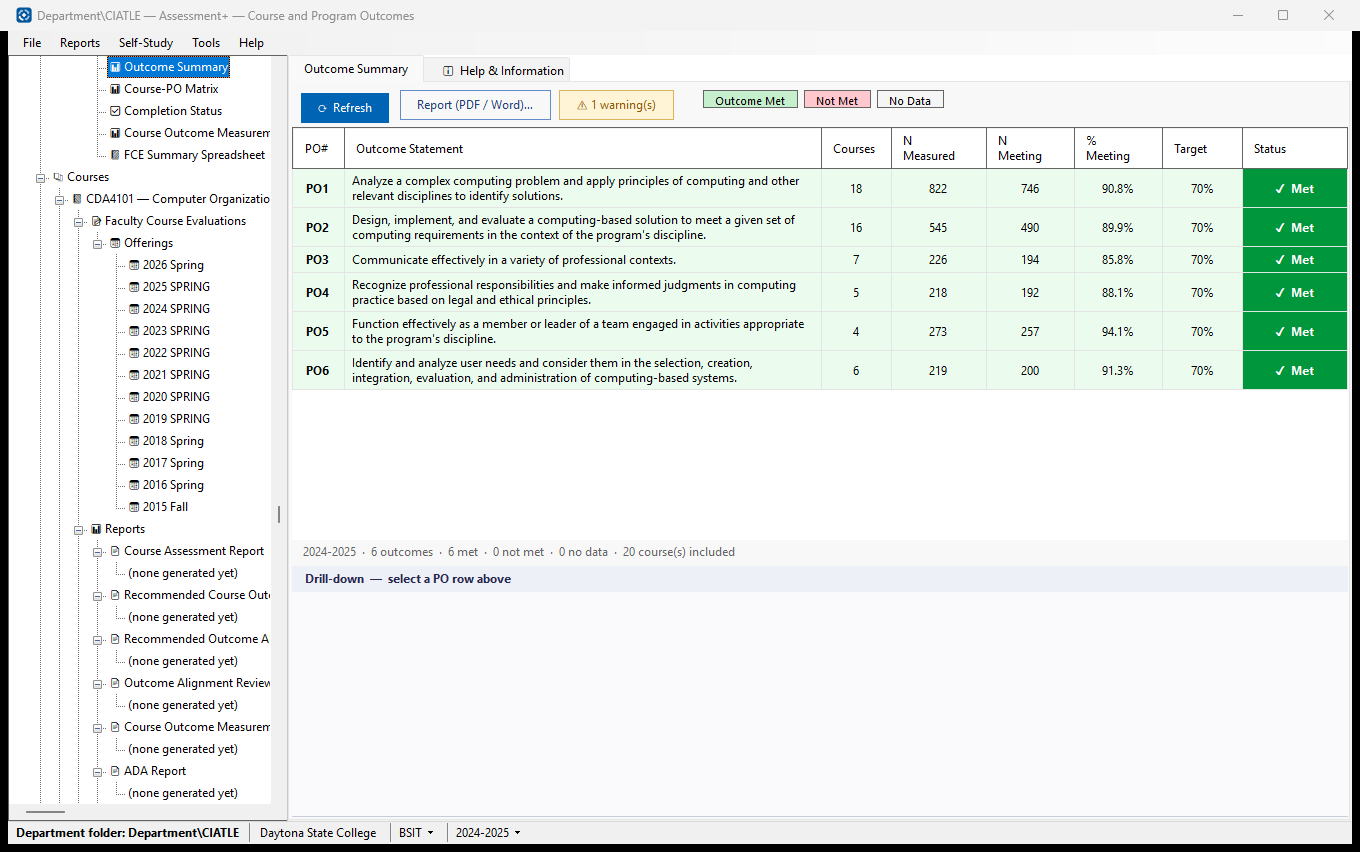
For each program outcome in the chosen academic year: how many students were measured, how many met the measure's passing score, and whether the outcome was met.
How to use it
- Check the program and academic year in the drop-downs in the status bar at the bottom of the window; change them there if needed.
- Read the rows: green is met, red is not met, grey has no data.
- Select a row to see, underneath, every course, course outcome and measure behind its numbers.
- Click Report (PDF / Word)… for a printable copy you can save.
What it means, and what to watch for
- Courses — how many courses contributed measures to this PO.
- N Measured / N Meeting — students measured, and students who met the measure's own passing score, added across courses.
- Target — the percentage of measured students who must reach their measure's threshold for the PO to be met; the PO is met when % Meeting reaches it. Each outcome's Target is set under Program Outcomes.
- Threshold — the score a student must reach on a measure to count as meeting it. Each measure in the list underneath shows its threshold and its own target (its target is the same number as its threshold unless the course set a different one on the Outcome Measures tab).
- Where a course outcome has a primary measure (★) in an offering, only that one counts; otherwise all its measures count.
- Numbers come from each course's attached course file, for the offerings ticked for this year on the course's screen (Program Courses ▸ the course); a course with no file uses its imported submission, marked [imported submission].
- A course left out of this year's reports on its own screen adds nothing and is counted in the status line as "left out by choice"; the printable report names it. A course with no offering ticked is not left out — it is listed under ⚠ Warnings.
- ⚠ Warnings — data that could not be used, and why. ⟳ Refresh reads the data again.
- Program Courses ▸ 📊 PO Performance adds up every year at once, so its numbers can differ from these.
See also
- Completion Status — which courses are still missing data.
- Course-PO Matrix — which courses address which outcomes.
Course-PO Matrix
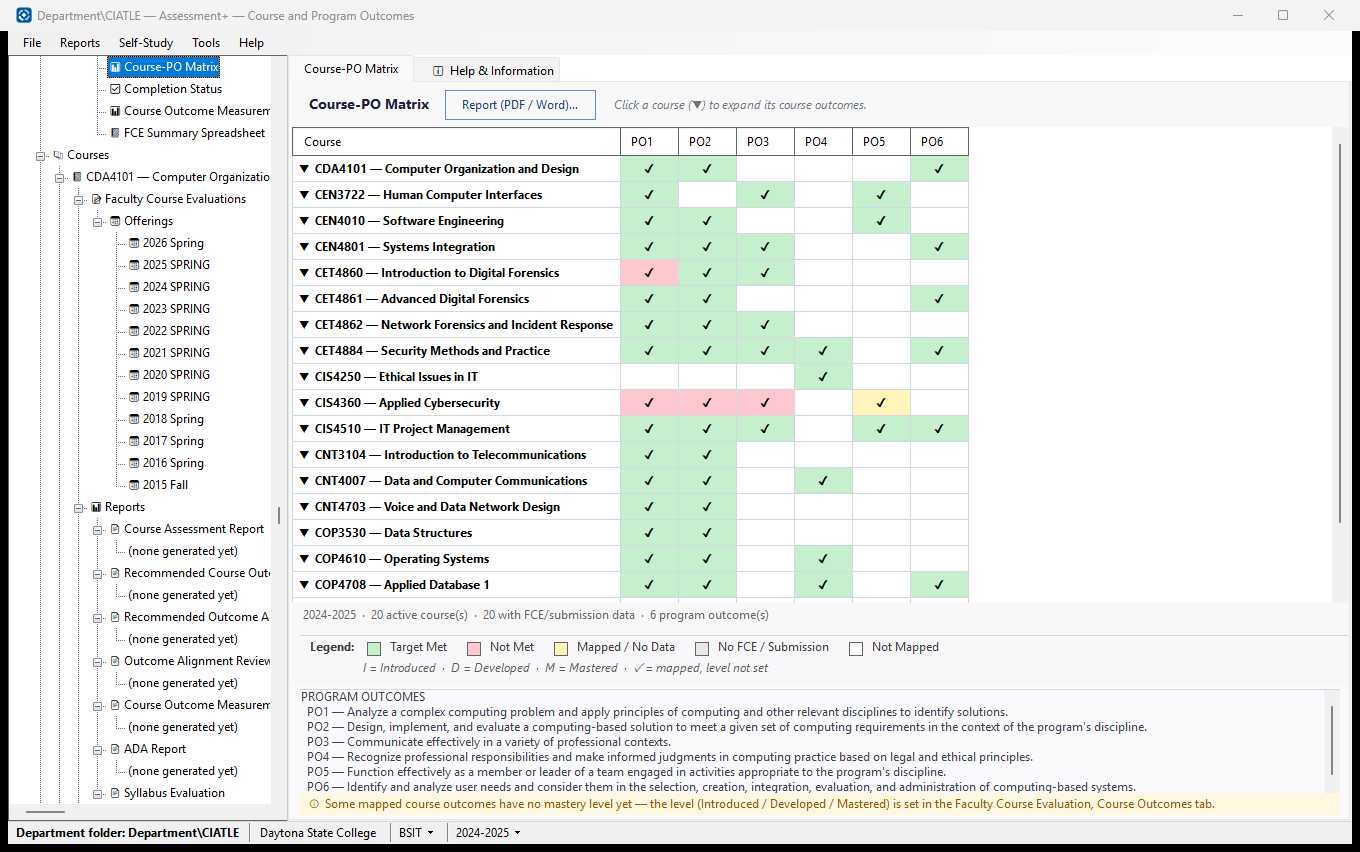
Courses down the side, program outcomes across the top: which courses address which outcomes, at what level, and whether their measures met their target in the chosen academic year.
How to use it
- Check the program and academic year in the drop-downs in the status bar at the bottom of the window.
- Click a course (▼) to expand it into its course outcomes and see which PO each maps to; click again (▲) to fold it.
- Hover over a cell for the course outcomes and counts behind it.
- Click Report (PDF / Word)… for a printable copy.
What it means, and what to watch for
- I / D / M — the course Introduces, Develops or Masters the outcome. ✓ means mapped but no level set; set levels in the course's Faculty Course Evaluation, Course Outcomes tab.
- Green: target met. Red: not met. Yellow: mapped, but no measures this year. Grey: no course file and no submission. White: not mapped.
- Met means the percentage of students who reached the measure's threshold (the score a student must reach) is at or above the target (the percentage of students expected to reach it). The target is the measure's own where the course set one — its threshold when no separate target was set — otherwise the program outcome's Target.
- The PO statements are listed below the table.
- [submission] — the course's data came from an imported .ciasub, not its course file.
- [left out by choice] — someone chose to leave the course out of this year's program reports on its own screen (📋 Program Courses ▸ the course). It is shown in grey and adds nothing to the counts.
- Measures count only from the offerings ticked for this year on each course's screen.
See also
- Outcome Summary — the totals per PO.
- Curriculum Map (I/D/M) under the program's 📊 Reports (or the Reports menu) — a printable map of the levels of every course, whatever the year.
- Measure Coverage by Program Outcome under the program's 📊 Reports (or the Reports menu) — for the same year, which courses gave counted measures to each outcome, and whether each has the recommended three. No levels and no results.
Completion Status
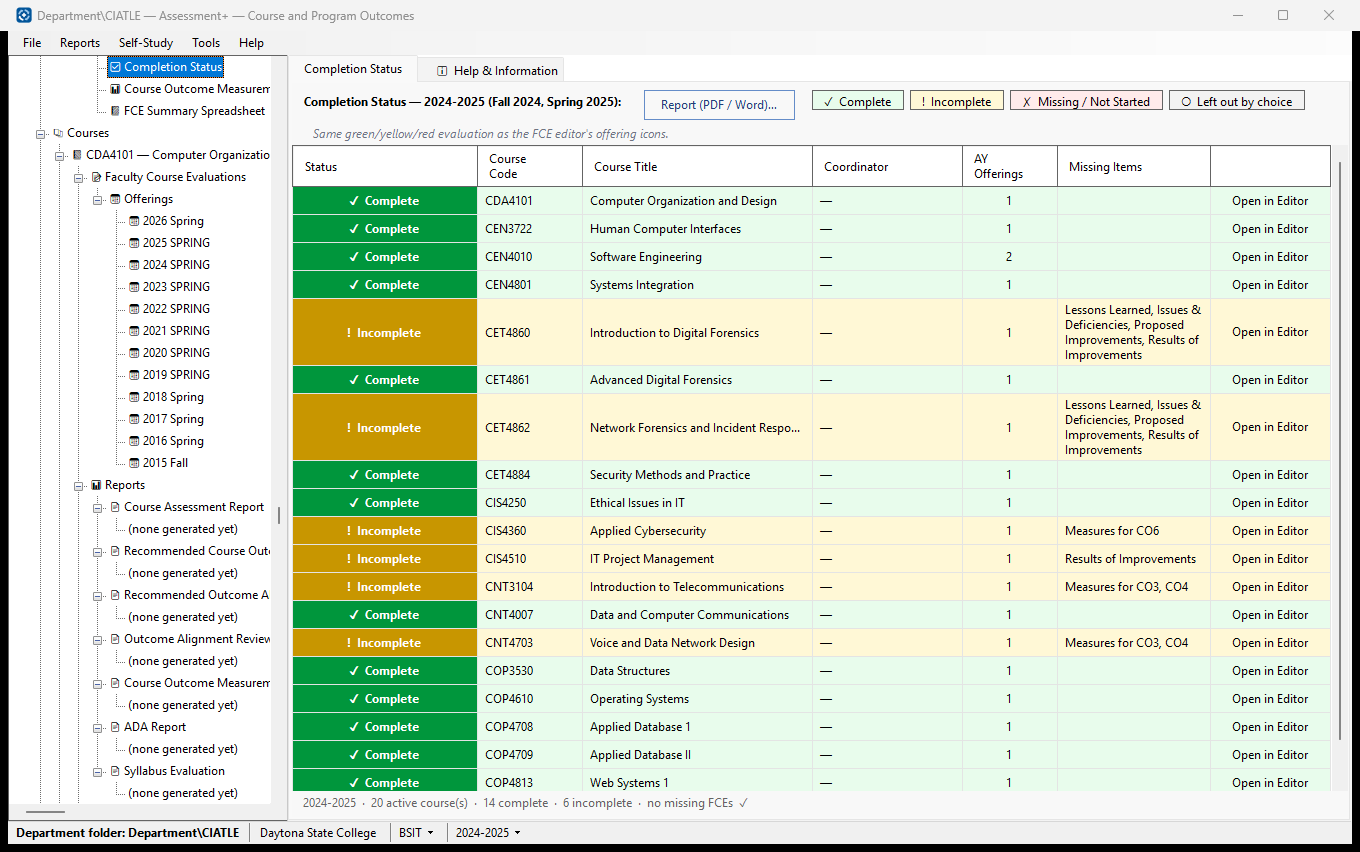
Which of the program's courses have finished entering this academic year's Faculty Course Evaluation, and exactly what is missing from the rest.
How to use it
- Check the academic year in the title; change it in the drop-down in the status bar at the bottom of the window.
- Read Missing Items for each yellow or red row.
- Click Open in Editor to finish a course's evaluation, or Attach FCE… when the program has no course file for it.
- Click Report (PDF / Word)… for a printable list to send to faculty.
What it means, and what to watch for
- Complete (green) — every offering in the year has grades, a numeric result for each active course outcome, and the four narratives.
- Submission imported (green) — no course file is attached, but a faculty .ciasub was imported.
- Incomplete (yellow) — some data is in; Missing Items lists the rest.
- Red — not started, no offering counted for this year (none in its terms, or none ticked on the course's screen), or no course file attached (or it cannot be read).
- Left out by choice (grey) — on the course's screen (Programs ▸ the program ▸ 📋 Program Courses ▸ the course) someone chose "Leave this course out of the year's program reports". It is not counted as missing work; untick that option there to bring the course back.
- Only active Program Courses are listed; Support Courses are not assessed by the program.
- The colours are the same as the offering icons in the course editor.
See also
- Submissions and Imports — bring in faculty files.
- Academic Years — which terms the year covers.
Program Outcome Results
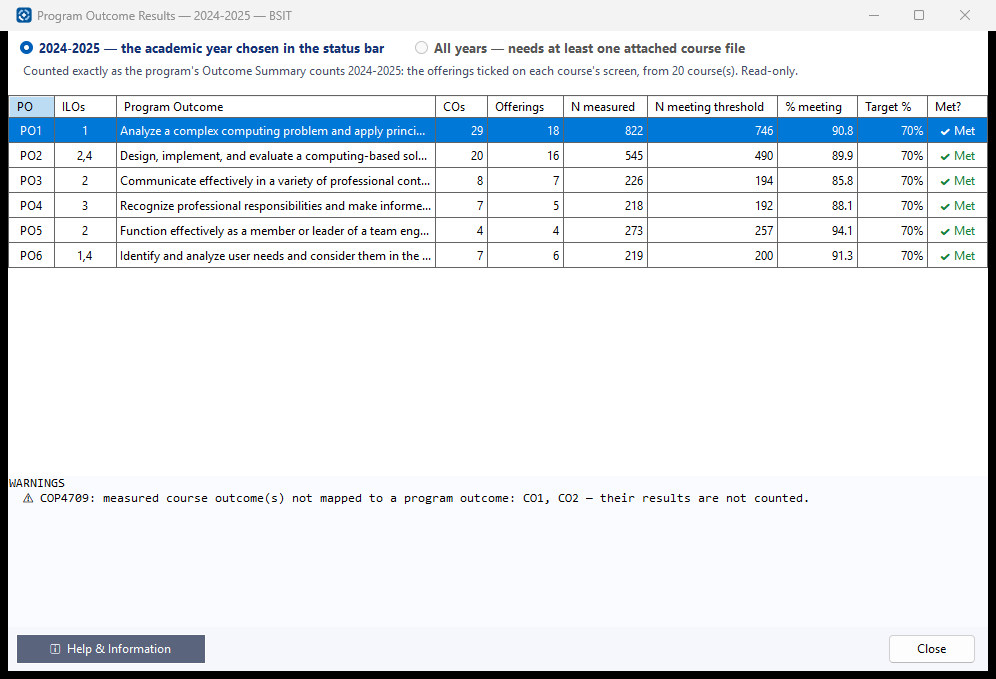
Each program outcome's results, added up from the program's courses: for the academic year chosen in the status bar, or for every year together.
How to use it
- Check the choice at the top. It starts on the academic year chosen in the drop-down in the status bar at the bottom of the main window; to see another year, close this window, change the year there and open it again.
- Choose "All years" to add up every offering in every attached course file instead. With no course file attached, only the one-year view can be shown, from imported submissions.
- Read the rows; select one to see the courses behind it below.
- Read the warnings for courses that were left out, and why.
What it means, and what to watch for
- For one year the figures are exactly those of the program's Outcome Summary for that year: the same offerings (the ones ticked on each course's screen), the same measures (a course outcome's primary measure when it has one, otherwise all its measures), imported submissions for courses with no file, and no figures from a course left out of the year's reports.
- All years counts every measure in every offering of every attached course file, so it can differ from any one year's figures. It uses course files only, not imported submissions.
- COs — course outcomes behind the PO: for a year, those that gave results; for all years, every one mapped to it. Offerings — the course offerings that gave results. N measured — students measured. N meeting threshold — students who met the measure's own passing score. % meeting — the share who did. Target % — the program outcome's Target % (the share of students expected to meet the threshold). Met? — whether % meeting reached the target.
- The lines below the table, one per course: COs — its course outcomes behind the PO; N measured — students measured; meeting — students who met the measure's passing score; % — the share who did; measures — the measurement tools the figures came from.
See also
- Programs ▸ the program ▸ 📊 Reports ▸ Outcome Summary — the same year's figures, with every measure listed, as a report that can be saved as PDF or Word.
FCE Summary Spreadsheet
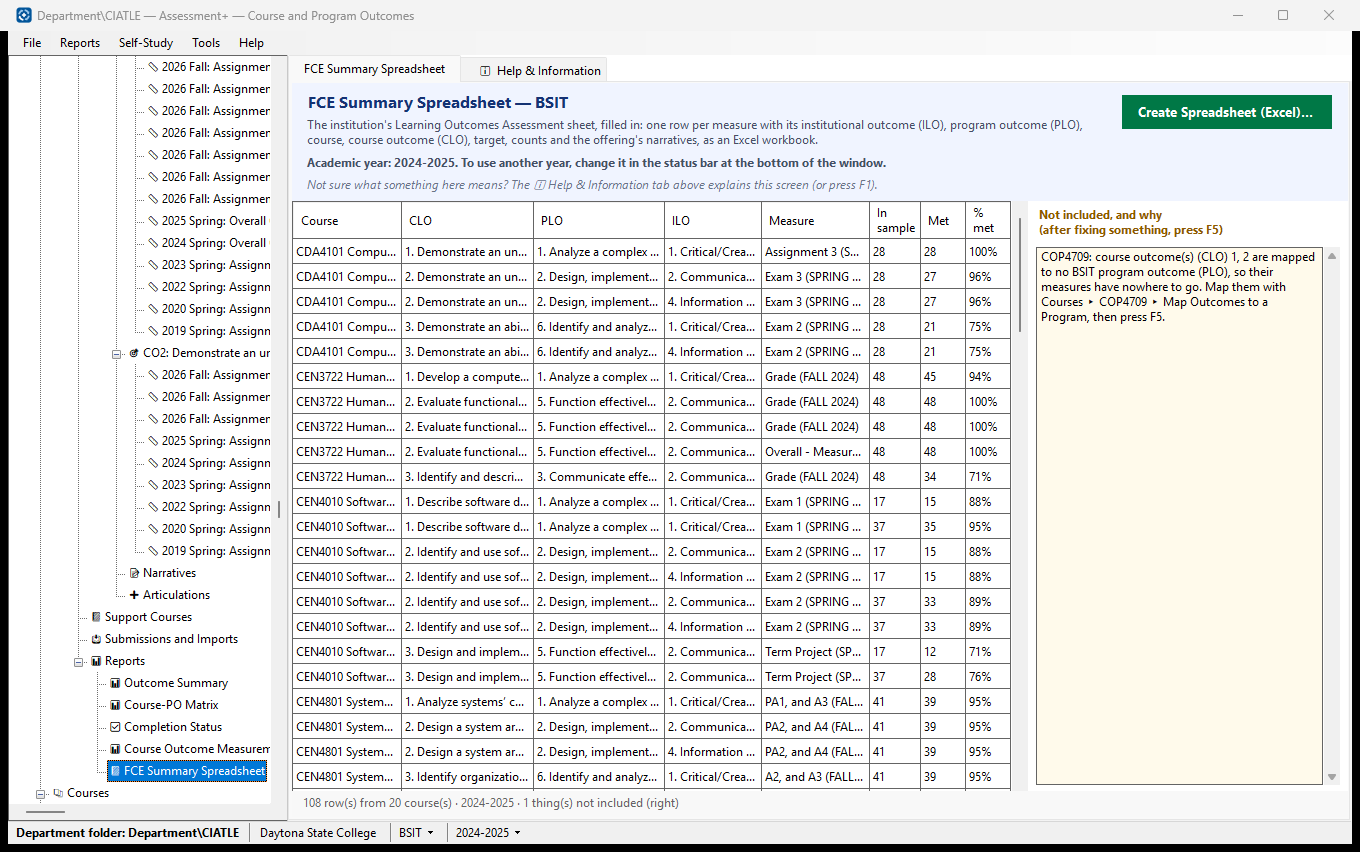
The institution's required Learning Outcomes Assessment sheet for this program and academic year, filled in from what Assessment+ already has: the institutional outcomes, the program outcomes, and each course's Faculty Course Evaluation.
How to use it
- Check the academic year at the top. It is the one chosen in the drop-down in the status bar at the bottom of the window.
- Look over the preview: one row per measure. Anything that could not be included is listed on the right with the reason.
- Click "Create Spreadsheet (Excel)…", choose where to save it, and open it in Excel.
What it means, and what to watch for
- The sheet uses the institution's words: ILO = institutional outcome, PLO = program outcome (PO elsewhere in Assessment+), CLO = course outcome (CO elsewhere in Assessment+).
- One row per measure, per offering in the year, per institutional outcome (ILO) its program outcome (PLO) maps to. A PLO mapped to two ILOs gives each measure two rows.
- Measures are chosen as in the Outcome Summary: when a course outcome has a primary measure (★) with counts, only that measure is listed; otherwise every measure with counts. Where no counts are in yet, every defined measure is listed so the sheet shows what will be measured.
- Achievement Target is the share of the class expected to reach the measure's threshold: the measure's own target where the course set one on its Outcome Measures tab, otherwise the PLO's Target % (set under Program Outcomes). The achievement sentence adds the score each student needs: the measure's own threshold, or the PLO's default score threshold.
- Sample Size is the class size from the offering's grade counts. Total in Sample and Met the Target are the measure's counts. Percentage Met is a formula, so it follows if you correct the counts in Excel, and it is blank rather than #DIV/0! when there are none.
- Strategies/Learning Activities, Analysis and Use of Results come from the offering's Lessons Learned, Issues/Concerns/Deficiencies, and Proposed Improvements (with Results of Improvements). They repeat on every row of that offering.
- Column J is hidden and empty, as in the institution's template, so every other column has the same letter and rows can be copied into the institution's own workbook.
- To fill a missing ILO: map the PLO to institutional outcomes under the program's Program Outcomes. To include a course that only has an imported submission: attach its course file.
- "Per offering in the year" means the offerings ticked for this year on each course's screen (Program Courses ▸ the course). A course left out of the year's reports there is not in the sheet, and is listed as "left out by choice" under what was left out.
See also
- Completion Status (under this program's Reports): which offerings still need data.
- Institutional Information ▸ Institutional Outcomes: the ILO titles in column A.
Course Outcome Measurement Assessments
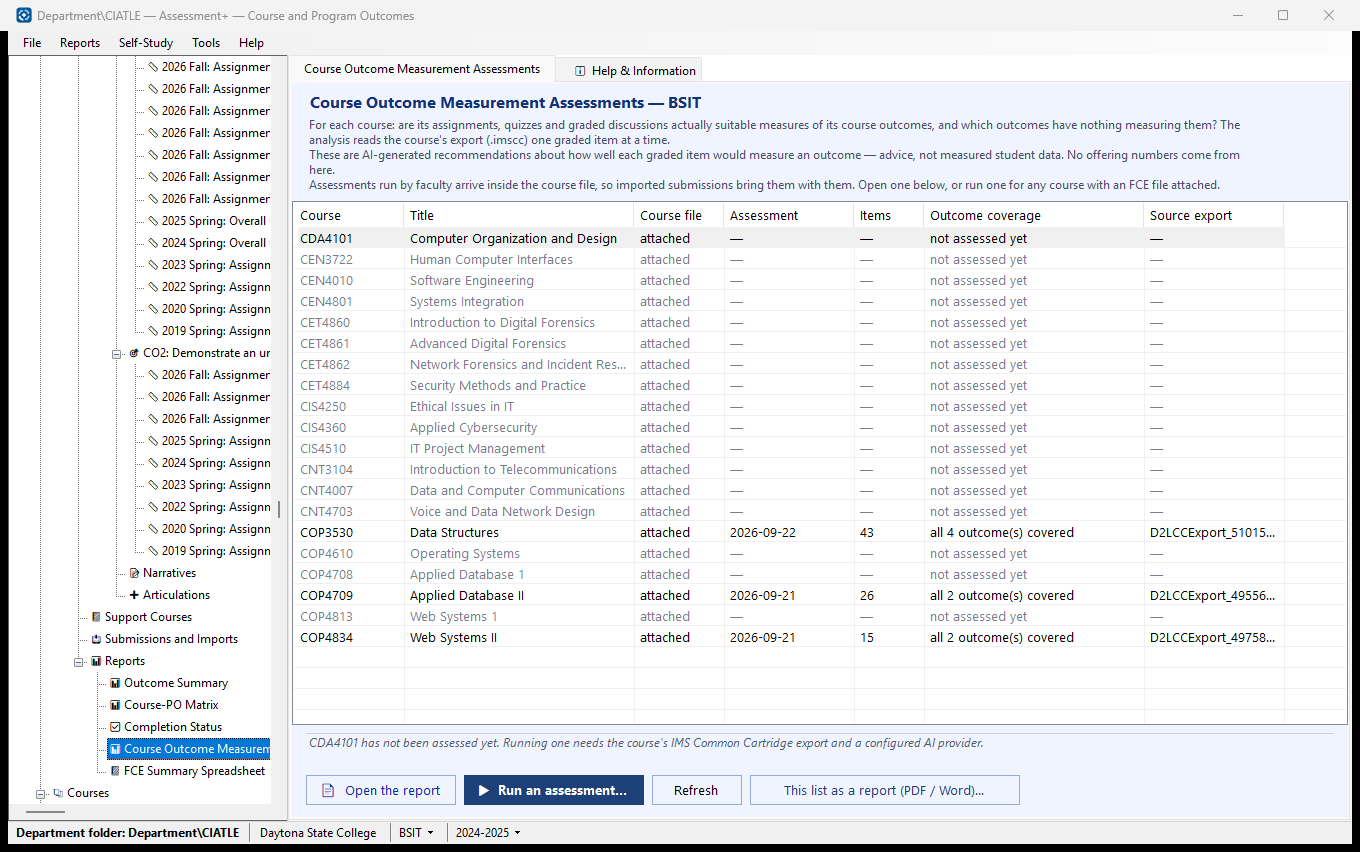
Which courses in this program have had their graded items assessed against their course outcomes — the coordinator's view of where measurement is thorough and where it is thin.
How to use it
- Read down the list: each row is a course in this program, with the date of its most recent measurement assessment and how many of its outcomes came out covered.
- Select a course with an assessment and click "Open the report" to read it. It opens in the report viewer, where it can be saved as PDF or Word.
- Select a course whose FCE file is attached and click "Run an assessment…" to produce one. It uses the same wizard the faculty member would use, so there is one report shape for both.
- Click "This list as a report (PDF / Word)…" for a copy of the whole list to send or file. ("Open the report" opens one course's own assessment.)
What it means, and what to watch for
- A measurement assessment reads the course's export (.imscc) and judges, item by item, how well each graded item measures each course outcome. It needs a configured AI provider.
- An assessment travels inside the .ciafce file, so a submission imported from a faculty member brings theirs with it — you do not have to re-run it.
- Course file "not attached" means no course file is attached to that course yet, so there is nothing to assess. Attach one first: Programs ▸ the program ▸ 📋 Program Courses ▸ the course ▸ 📁 Attach FCE….
- Assessment — the date it was run; (partial) means only some items were analysed, so an outcome shown as unmeasured may simply not have been reached. Items — how many graded items were analysed. Outcome coverage — how many course outcomes have at least one suitable measure. Source export — the course export the assessment read.
- Click Refresh after importing faculty submissions; assessments arrive inside their course files.
- Each assessment's report is kept once, under Courses ▸ the course ▸ 📊 Reports ▸ Course Outcome Measurement Assessment, dated when the assessment was made. One that arrived inside a course file is kept there the first time you open it here; opening it again opens the same report, so nothing is listed twice. PDF and Word copies are listed under it and under the course's 📦 Exports.
- What is sent, for each graded item: its title, type, module and text from the course export, its gradebook column heading and points, and the course outcomes — never a gradebook row. The item text is checked for student information first.
See also
- Completion Status — which offerings still need their data entered.
- 📊 Reports under a course — where a single course's assessments are listed and run.